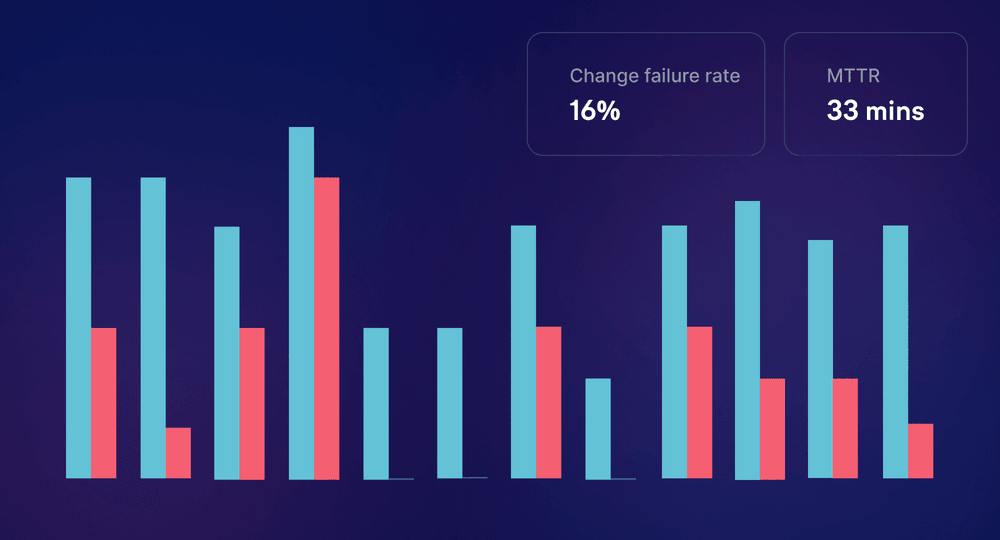
Out of all the four DORA metrics, change failure rate is the one causing the most headache to engineering organizations. At Swarmia, we’ve spent quite a bit of time making sure we get it right to help software teams drive good business outcomes.
In this blog post, I will shortly discuss what DORA change failure rate is, explain how it should be calculated, and share some common mistakes organizations make when measuring change failure rate.
What is the definition of DORA change failure rate?
The change failure rate of a team is defined by answering the question:
For the primary application or service you work on, what percentage of changes to production or releases to users result in degraded service (for example, lead to service impairment or service outage) and subsequently require remediation (for example, require a hotfix, rollback, fix forward, patch)?”
In short, DORA change failure rate is the percentage of deployed changes that cause a failure in production.
Why should you measure DORA change failure rate?
DORA metrics are currently the best-researched metrics in software engineering productivity that have a proven relationship with business performance. The goal of using DORA metrics is to maximize your ability to iterate quickly, while making sure that you're not sacrificing quality.
To achieve this, there are DORA metrics for speed (deployment frequency and change lead time) and quality (change failure rate and time to restore service). The quality metrics are there to alert you when you're going too fast.
To summarize, you measure DORA change failure rate to maintain engineering quality while accelerating your engineering performance.
How should you calculate DORA change failure rate?
To calculate DORA change failure rate you need to know three things:
- The number of production deployments. The total number of production deployments or releases you’ve made.
- The number of “fix-only” deployments. The number of production deployments or releases that were only for remediation (a hotfix, rollback, fix forward, patch).
- The number of failed changes. The number of production deployments or releases causing an incident or a failure.
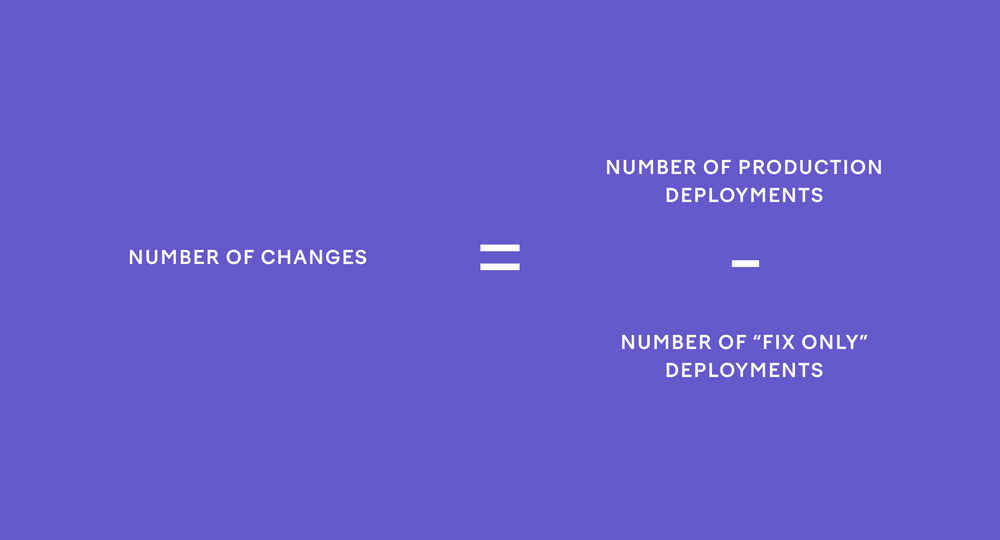
To get your change failure rate, start by calculating the number of changes. That’s the number of production deployments minus the number of “fix-only” deployments.

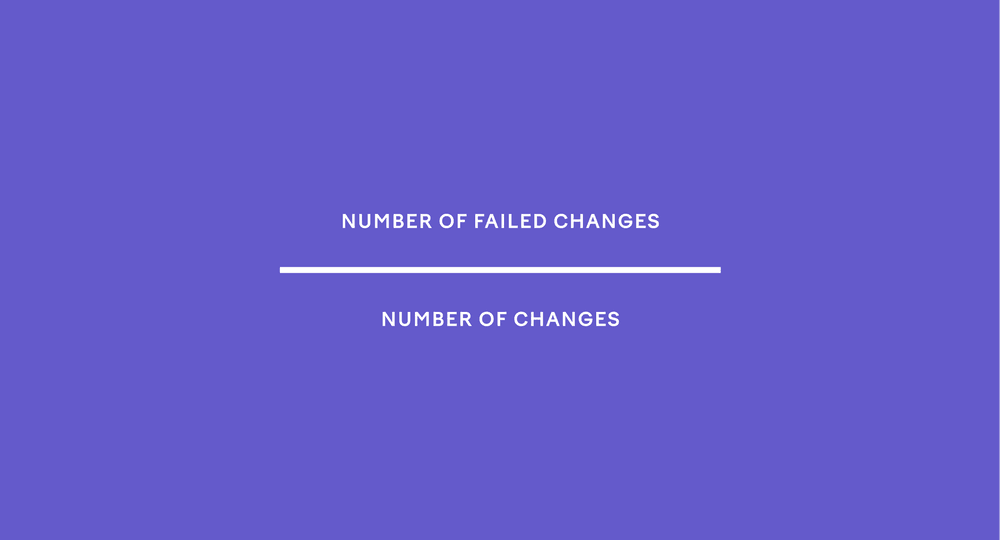
Once you know the number of changes, you can calculate your team’s change failure rate by simply dividing the number of failed changes by the number of changes.

In theory, this sounds simple. However, there are some common pitfalls that you should be aware of when you start measuring the change failure rate of your team.
Common mistakes measuring DORA change failure rate
1. Including all incidents in change failures
The quality of incident data varies heavily between teams and organizations. Often, incident data doesn’t readily differentiate between (1) incidents that were caused by changes that were made by the team and (2) incidents that were caused by external factors, such as cloud provider downtime.
Categorizing the data is extra work, and it can be tempting to include all incidents when calculating your change failure rate. This works against the purpose of change failure rate: to tell you when you’re moving too fast and compromising on quality. Also, seeing the change failure rate go up because of external factors can make the metric feel irrelevant to the team.
2. Including “fix-only” deployments in the number of changes
One mistake teams make with their definition of “change failure” is that they don’t exclude “fix-only” deployments from the total number of changes. As a result, change failure rate calculations may be skewed.
For example, let’s imagine we have a change called “add todo list sorting” that we’re trying to deploy. Unfortunately, our pre-release testing process fails miserably. Twice. As a result, our change is successful only on the third try, “Add fixed fixed todo list sorting.”
1701ad6: Add todo list sorting
pi31415: Revert "Add todo list sorting"
2aleph0: Add fixed todo list sorting
a1337cd: Revert "Add fixed todo list sorting"
0042sdc: Add fixed fixed todo list sorting 🎉
If we include the “fix-only” deployments in the “number of changes” our change failure rate is 40% (2/5) suggesting that we deployed 3 successful changes to production. This is obviously wrong as it makes incident remediation look as if we’re successfully shipping improvements to users.
If we exclude the “fix-only” deployments, our change failure rate is ~67% (2/3), which is correct.
Note that if the software you build practically never has “fix-only” releases (commonly e.g. mobile apps), you can ignore this advice. In these cases, the number of “fix-only” deployments will be zero.
3. Measuring deployment failures instead of change failures
Some tools incorrectly measure change failure rate as the “percentage of workflows that fail to enter production.” Meaning, the number of deployment builds that failed on the CI/CD pipeline. While this number can also be useful, it’s very different from DORA change failure rate and only indicative of the quality of your CI/CD build (e.g. test flakiness).
Calculating a proper change failure rate requires incident data, which is usually located in a separate system (like PagerDuty) and needs to be connected to deployment data. It’s tempting for vendors to sell “easy DORA metrics support” by cutting some corners.
4. Gaming change failure rate
DORA doesn’t clearly define what “degraded service” means in practice. The definition of what counts as “change failure” is up to you. As a result, you can always improve your change failure rate just by having a more lax definition of “degraded service” and marking fewer deployments as failures.
When trying to define “degraded service” for measuring your change failure rate, ask: “what kind of failures in production are related to us trying to go too quickly?” Define, track, and mark these as change failures.
5. Trying to make too detailed conclusions from change failure rate
DORA categorizes team performance into four different levels: elite, high, medium, and low performers. For change failure rate elite, high, and medium teams all have the same change failure rate of 0-15%. This means that you can be “elite” even if 1/7 of your production deployments or releases fail.
The low granularity of the metric can be explained by the high variability of production incidents. In change failure rate, a multi-day outage and a change affecting 10% of your users for 15 minutes are both counted as single failures.
When using DORA change failure rate, keep its limits in mind. The best uses for change failure rate are:
- Getting priority for improving software quality (like adding automated tests), when you clearly have a high (> 15%) change failure rate.
- Keeping track of the trend in your engineering quality. When you notice your change failure rate trending upwards, make sure you understand the nature of the failures that you're experiencing.
If you want to understand software engineering productivity more deeply, you need to go beyond DORA metrics.
Conclusion
When you start measuring DORA change failure rate, make sure you understand why you’re doing it and how it relates to the other three DORA metrics. This will allow you to define how to correctly calculate change failure rate for your teams.
Remember, your goal is to drive good business outcomes and not to measure just for the sake of measuring.


