3. Developer productivity
Effective software organizations make fast and consistent progress toward their goals.
The unfortunate reality about complexity in software is that if you just continue doing what you’ve always been doing, you’ll keep slowing down. When starting a fresh project, you’ll be surprised by how much you can accomplish in a day or two. In some other, more established environments, you could spend a week trying to get a new database column added.
Many things that slow down work are systemic, not individual. Even the most talented engineer might not fully understand how much time is wasted when work is bounced between teams, half-completed features are shelved as priorities change, or all the code gets reviewed by just one person.
It’s easy to think you’re solving a quality problem by introducing code freezes and release approvals, but you might only be making things worse.
In this chapter, we’ll talk about some of the perils of measuring productivity before we move on to the mechanics of making it happen in a way that’s perceived as broadly beneficial.
But first, let’s talk about the biggest question of all: what is productivity, anyway?
Defining developer productivity
If you ask a group of seasoned engineering leaders to define developer productivity, there will typically be no single answer. Some will insist it can’t be measured at all.
We consider developer productivity in the context of how organizations can minimize the time and effort required in the software delivery process to create valuable business outcomes. We will focus primarily on team- or service-level delivery and eliminating bottlenecks — often process bottlenecks — in the software delivery process.
We’ll also center our conversation on aggregate productivity instead of the efforts and contributions of individuals. A healthy productivity effort may involve automating more parts of the team’s deployment process, addressing flaky tests that cause failing builds, or getting a team to commit to reviewing open pull requests before starting their own work.
A healthy productivity effort should not require a certain number of pull requests — or story points, or tokens — from each engineer every week or month.
That kind of individual output target rarely creates business value, and reliably creates a toxic working environment.
Classic productivity challenges
Productivity challenges are rarely about output. Consider these potential culprits when trying to debug a productivity issue in your organization:
- Insufficient collaboration. Individual efforts may seem efficient in the short term, but they lack the collective intelligence and shared context that comes from teamwork. When larger issues are routinely completed by single contributors, the team is missing opportunities for more effective planning, prioritization, and knowledge sharing. Collaboration is essential to improving cycle time — not because individual work is bad, but because teams that collaborate well are better at staying aligned and reducing rework.
- Multitasking. Taking on too many tasks simultaneously slows progress and creates waste. When engineers are juggling more open work items than the team can reasonably handle, everything takes longer and nothing gets the sustained attention it needs. Pay attention to qualitative signals here, too: if the team feels overwhelmed by their WIP levels, they probably are.
- Large increments. If projects often overrun their estimates, the team may be trying to tackle problems that are too large to reason about effectively. Large increments make it harder to detect scope creep, course-correct mid-stream, and deliver value incrementally. The longer a piece of work takes, the more likely it is that assumptions made at the start have become stale.
- Planning quality. Scope creep is common and not necessarily a bad thing — mitigating its effects should be focused on building in time for learning, feedback, and discovery rather than reducing it through extensive up-front specification. But when long-running tasks could clearly have been broken into smaller, more manageable parts, that’s a planning problem you should examine further.
- Cross-team sequencing. Even in the best-designed organizations, it’s sometimes necessary for two teams to work together to deliver customer value. Without care and attention, these partnerships can struggle to stay coordinated, with each team delivering the right thing at the wrong time for the other to make progress.
Productivity table stakes
Just as we discussed organizational table stakes in the first chapter — empowered teams, rapid feedback, and outcomes over output — there are three clear ways of working that you’ll see on any highly productive team.
- Limited queue depth. Don’t let work pile up waiting to be started. The longer the queue, the longer everything takes and the harder it is to predict when anything will be done.
- Small batch sizes. Ship in small pieces. Smaller changes move faster, fail less dramatically, and are easier to understand when something goes wrong.
- Limited work-in-progress (WIP). Don’t start more than you can finish. When a team juggles too many things at once, everything slows down and nothing gets the attention it needs.
One might argue that the introduction of AI into our development processes renders some or all of these moot. What’s the matter with a large diff if AI will do the code review? What’s wrong with an engineer guiding 10 different agents to work on 10 different things? Our conclusion after observing thousands of teams is that these table stakes do indeed still matter, though the details might shift a bit.
AI or not, a massive PR introduces more quality and stability risk than a small one. Working on 10 things at once might sound appealing and achievable in an AI world, but engineers say it can be exhausting. Worse, many of these work items will get stuck somewhere in the review or release process. From a product development flow perspective, optimizing for code generation only makes sense if there is zero friction downstream.
Limited queue depth
It’s okay to admit it: we’ve all added a task to a backlog with a vague certainty that it will never get done.
Limiting queue depth means rigorously monitoring and managing the number of tasks awaiting work. This involves implementing systems to track and control the queue size, such as using a kanban board to visualize work and enforce limits on the number of items in each stage. This principle also means you can’t let backlogs grow unchecked, as this can lead to delays, rushed work, and increased stress.
Regularly review your work queues and adjust priorities to ensure that valuable and time-sensitive tasks are getting addressed promptly. When you encourage teams to complete current tasks before taking on new ones and use metrics like cycle time to identify bottlenecks, you can noticeably improve the flow and efficiency of the development process.
Implementing this in practice usually means limiting the number of tasks awaiting development, review, or deployment at any given time. In addition to providing clarity about what to work on next, this practice also dramatically improves the predictability of delivery once something reaches that initial awaiting development status.
Small batch sizes
Breaking down large projects into smaller, more manageable parts allows for quicker completion of each part, which leads to faster feedback and iterative improvements. For instance, deploying completed tasks incrementally rather than releasing a large set at once makes it easier to release more tasks in a given period of time; regressions tend to be small, readily attributed, and readily fixed without blocking other tasks.
Large batches often complicate integration and make it difficult to track down problems. A continuous delivery model, where small updates are released whenever they’re ready, is a practical application of this principle. Encourage teams to think in terms of small changes, which helps in managing risk and improving the ability to adapt to new information.
That doesn’t mean that smaller batches are easy to create: you might need to come up with a creative strategy to split something complex into smaller pieces. That creativity is most likely to exist when an engineer is approaching a problem with a solid understanding of both business outcomes and technical details.
Limited WIP
When you introduce and regularly monitor WIP limits, you make sure that teams focus on completing ongoing tasks before starting new ones. Overloading team members with multiple tasks leads to reduced focus and increased cycle times, even if AI is writing most of the code. A culture where teams are encouraged to complete current work before embarking on new tasks improves focus, reduces waste, and speeds up delivery.
The kanban process embraces this explicitly, although you don’t need to use kanban to follow this principle. In that process, the team always focuses on completing the team’s in-flight tasks before starting new ones — a process sometimes called “walking the board from right to left” — to encourage teammates to help each other before starting a new task. Similarly, scrum limits the number of story points in an individual sprint.
In the absence of WIP limits, a team can quickly start to juggle more than it can reasonably handle, and it’s common for tasks to remain in progress for an extended period even if they aren’t being actively worked upon.
Frameworks for thinking about productivity
There are a couple of frameworks that can be useful when considering the broad topic of productivity.
The DORA framework is a standard in the productivity realm for a reason: it offers a set of valuable metrics that shed light on where engineering teams might be able to improve their software delivery. DORA sets the benchmark for your team’s processes by providing a baseline that captures a team’s current state.
The aim isn’t to become obsessed with numbers but to continually evaluate whether you’re satisfied with what the numbers are telling you.
The success of the DORA framework — which originated from work by Dr. Nicole Forsgren, Jez Humble, and Gene Kim — lies in its simplicity and ability to capture various aspects of software development through its five metrics: change lead time, deployment frequency, failed deployment recovery time, change fail rate, and deployment rework rate. These metrics are in healthy tension with each other, which means improving one could unintentionally lead to the degradation of another.
Of course, there are limitations to the DORA metrics. While they offer a snapshot of your team’s software delivery performance, they don’t explain why something might be off. Nor do they tell you how to improve. DORA’s software delivery metrics are not a diagnostic tool; they don’t point out bottlenecks in your processes or identify cultural issues inhibiting your team’s effectiveness. It’s much like having a compass — it will tell you what direction you’re headed in, but not what obstacles lie in the way or how to navigate around them. For this, you’ll need to look beyond DORA’s software delivery metrics and into its further research, or combine them with other frameworks.
The SPACE framework, developed by Forsgren along with Margaret-Anne Storey, Chandra Maddila, Thomas Zimmermann, Brian Houck, and Jenna Butler, grew out of an attempt to create a more comprehensive tool to capture the complex and interrelated aspects of software delivery and operations. The goal was to create a model that would acknowledge the competing tensions within software development and use those tensions as catalysts for improvement.
SPACE embraces quantitative and qualitative metrics, identifying five critical dimensions of software delivery and operational performance. The acronym stands for satisfaction, performance, activity, communication and collaboration, and efficiency and flow.
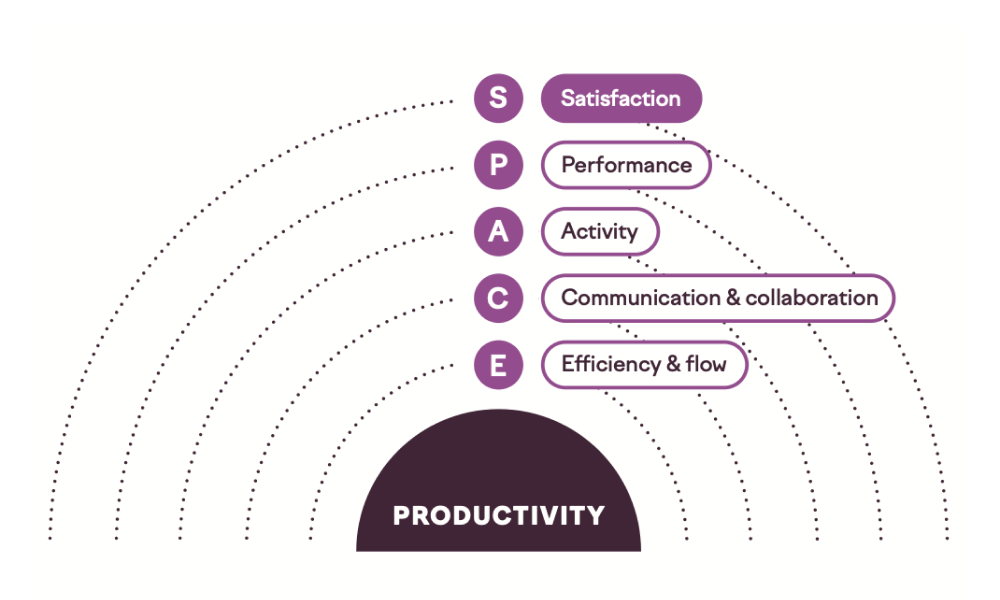
Satisfaction is how fulfilled and satisfied engineers feel about their work, team, tools, and culture. It also involves evaluating how that sentiment affects their engagement and fulfillment based on the work they do.
Performance evaluates whether the output of the engineering organization has the desired outcome relative to the investment. For example, what is the ROI of adding 20 engineers to an organization? This is notoriously difficult to measure in a concrete way, meaning it’s more of a theoretical concept than a roadmap to specific metrics.
Activity is a count of actions or outputs completed while performing work. These include outputs like design documents and actions like incident mitigation, as well as commits, pull requests, and code review comments.
Communication and collaboration captures how people and teams communicate and work together.
Efficiency and flow captures the ability to complete work or make progress on it with minimal interruptions or delays, whether individually or through a system.
SPACE offers a comprehensive (though fuzzy) approach to improving productivity. It acknowledges the interplay between different aspects of software development and provides a balanced and holistic model for assessment and improvement. Still, it is just a framework — it doesn’t offer any specifics about what exactly to measure or what “good” should look like.
A set of universal metrics can’t fully capture the effectiveness of your organization because organizations vary in size, age, culture, and capabilities. A mature, larger organization may have very different challenges and therefore different areas to focus on for improvement compared to a smaller, newer organization. This means that while DORA metrics are incredibly useful, they must be complemented by other qualitative assessments, leadership insights, and perhaps more localized metrics that take into account the unique characteristics of specific teams.
Unfortunately, there is no definition of productivity that boils down to keeping an eye on a few simple metrics. Measuring productivity is actually pretty hard.
Measuring productivity
Engineering organizations measure developer productivity to find bottlenecks, make better resourcing decisions, and make sure engineering work is lined up with what the business needs. It also helps you understand how predictable your delivery really is — and acts as an early warning system when teams are taking on more than they can handle.
Even when the intent of measuring productivity is to improve team and organizational effectiveness, individual engineers can still be concerned that the data will be used against them. There’s a pervasive worry that these metrics could translate into some form of individual performance review, even when that’s not the intended use. This concern can contribute to a culture of apprehension, where engineers might be less willing to take risks, innovate, or openly discuss challenges. Any perception that the data will be weaponized for performance purposes can doom an effectiveness effort. Say that you won’t use the data to target individuals and mean it.
Being open about what you’re measuring, why you’re measuring it, and what you’re not going to do with the data helps. The metrics themselves need to be visible too — not just the results, but how they’re collected and what they mean.
Metrics can highlight inefficiencies or bottlenecks and open the door to constructive dialogue about how to solve these problems.
Despite these risks, measuring productivity can encourage healthy conversations about organizational improvement. This becomes especially important as the business grows and it gets harder to keep engineering priorities and business goals in sync. Delivery metrics give you a common language for talking about how engineering is doing — one that makes sense to people outside of engineering too.
Choose your metrics carefully. Besides the risk of impacting the psychological safety of your engineers, there are other pitfalls to be aware of. Don’t rely on misleading or irrelevant metrics that provide a distorted view of what’s happening within the teams (for example, pull requests per engineer or lines of code committed). Poorly chosen metrics can lead to misguided decisions and even undermine the credibility of the whole measurement process.
Overemphasizing activity-focused numbers might lead engineers to game the system in a way that doesn’t truly improve their productivity.
This can result in a culture where superficial metrics are prized over substantive improvements, leading to technical debt and inefficiencies. On the other hand, if your metrics encourage engineers to submit more but smaller pull requests, you’re likely to see benefits in quality and speed of delivery.
Cycle time
The work of delivering code changes for individual tasks is often measured in terms of change lead time, sometimes called “cycle time.” This term comes from manufacturing processes, where cycle time is the time it takes to produce a unit of product and lead time is the time it takes to fulfill a delivery request.
In software development, these terms are often mixed. For most features, it might not be reasonable to track the full lead time of a feature, as in the time from a customer requesting a feature to its delivery. Assuming the team is working on a product that’s supposed to serve many customers, it’s unrealistic to expect features to be shipped as soon as the team hears the idea.
Although we’re reusing manufacturing terms, remember that there is no unit of product in software development. A car can only be sold by the manufacturer once. The work that happens in an engineering organization can be sold over and over again, with near-zero marginal cost for each additional sale of the exact same code.
When talking about change lead time for code, we’re talking about the time it takes for code to reach production through development, reviews, and other process steps. Change lead time is the most important flow metric because it indicates how well your engine is running. When diagnosing a high lead time, your team might have a conversation about topics like this:
- What other things are we working on? Start by visualizing all the work in progress. Be aware that your issue tracker might not tell the whole truth because development teams typically work on all kinds of ad hoc tasks.
- How do we split our work? It’s generally a good idea to ship in small increments. This might be more difficult if you can’t use feature flags to gradually roll out features to customers. Lack of infrastructure often leads to a bad branching strategy, with long-lived branches and additional coordination overhead.
- What does our automated testing setup look like? Is it easy to write and run tests? Can you trust the results from the continuous integration (CI) server?
- How do we review code? Is only one person in the team responsible for code reviews? How much of the code review process have you outsourced to AI? Do you need to request reviews from an outside technology expert? Is it clear who’s supposed to review code? Do we as a team value the work of doing code reviews, or is someone pushing us to get back to coding?
- How well do team members know the codebase? If all the software was built by someone who left the company, chances are that development will slow down for a while.
- Is there a separate testing/quality assurance stage? Is testing happening close to the development team, or is the work handed off to someone on the outside?
- How often do we deploy to production/release our software? If test coverage is low, you might not feel like deploying on Fridays, or if deployment is not automated, you won’t do it after every change. Deploying less frequently increases the batch size of a deployment, adding more risk and again reducing frequency.
- How much time is spent on tasks beyond writing code? Engineers need focus time; getting back to code during a 30-minute break between meetings is difficult.
There are perfectly good reasons for change lead time to fluctuate, and simply optimizing for a lower value would be harmful. However, when used responsibly, it can be a great discussion starter. Even better, consider tools that help visualize how this number moves over time, leading to a deeper understanding of trends and causes.
Change cycle time captures how long your epics, stories, and tasks (or however you plan your work) are in progress. Each team splits work differently, so they’re not directly comparable. If you end up creating customer value, it probably doesn’t matter whether that happens in five tasks taking four hours each or four tasks taking five hours each.
Deployment frequency
Depending on the type of software you’re building, “deployment” or “release” might mean different things. For a mobile app with an extensive QA process, getting to a two-week release cadence is already a good target (we’ll talk more about mobile teams shortly), while the best teams building web backends deploy to production whenever a change is ready.
Deployment frequency serves as both a throughput and a quality metric. When a team is afraid to deploy, they’ll do so less frequently. When they deploy less frequently, bigger deployment batches increase risk. Solving the problem typically requires building more infrastructure. Here are some of the main considerations:
- If the build passes, can we feel good about deploying to production? If not, you’ll likely want to start building tests from the top of the pyramid to test for significant regressions, build the infrastructure for writing good tests, and ensure the team keeps writing tests for all new code. Whether tests get written cannot be dictated by outside stakeholders; this needs to be owned by the team.
- If the build fails, do we know if it failed randomly or because of flaky tests? You need to understand which tests are causing most of your headaches so that you can focus efforts on improving the situation.
- Is the deployment pipeline to production fully automated? If not, it’s a good idea to keep automating it one step at a time. CI/CD pipeline investments start to pay off almost immediately.
- Do we understand what happens in production after deployment? Building observability and alerting takes time. If you have a good baseline setup, it’s easy to keep adding these along with your regular development tasks. If you have nothing set up, it will never feel like it’s the right time to add observability.
- Are engineers educated on the production infrastructure? Some engineers have never needed to touch a production environment. If it’s not part of their onboarding, few people are courageous enough to start making improvements independently.
Throughput
Throughput measures how much work a team finishes over a given period — usually counted in tasks, stories, or pull requests per week. Where cycle time tells you how long individual pieces of work take, throughput tells you whether things are getting done. A team can have a snappy cycle time on each task and still have low throughput if not enough work is entering and exiting the system. Or a team can have high throughput with a sluggish cycle time if it’s carrying a lot of WIP. The two metrics are related but tell you different things.
There’s a well-known relationship that exists here: throughput is a function of how much work is in progress and how long each piece takes. That means you can increase throughput by reducing cycle time, keeping WIP at healthy levels, or both. What you can’t do is increase throughput by piling on more work. That just drives up WIP, which drives up cycle time, and you end up completing things at the same rate — or slower — while everything takes longer and everyone feels worse about it.
The absolute number isn’t particularly meaningful on its own, since it depends entirely on how your team splits work. Comparing raw throughput between teams is almost never useful. What matters is the trend: is throughput stable, improving, or declining? And if it’s changing, what’s behind it?
Here are some questions worth asking when throughput drops or feels lower than it should:
- Are we finishing things, or just starting them? A team can feel extremely busy while throughput drops if new work keeps entering the system without existing work getting completed. Compare how often you start things to how often you finish them. If those numbers are diverging, WIP is growing and throughput will eventually pay the price.
- Has our cycle time increased? If individual items are taking longer, throughput will naturally decline even if nothing else has changed. The cycle time diagnostic questions earlier in this section are a good place to look.
- Are we carrying hidden work? Throughput metrics only capture work that’s tracked. If your team is spending real time on operational firefighting, incident response, or ad hoc requests that never make it into the issue tracker, your measured throughput will understate how much the team is actually doing — while also explaining why the planned work isn’t getting finished.
- Did team capacity change? This sounds obvious, but it’s easy to miss. People go on vacation, get pulled into cross-team initiatives, or take on mentoring responsibilities. Throughput will reflect those changes before anyone thinks to account for them.
- Are we blocked on external dependencies? If several pieces of work are stalled waiting on another team, a vendor, or a platform team, throughput will drop even though your team is doing everything within its control. That’s a signal that the dependency itself needs attention.
One of the most practical things about throughput is that it’s grounded in what happened, not what was estimated. Teams that track their throughput over time tend to develop better instincts for how much they can realistically take on, which makes for more honest planning conversations and fewer unpleasant surprises at the end of a sprint or quarter.
Flow efficiency
Flow efficiency measures the ratio of active work time to total elapsed time. If a task takes ten days from start to finish but only receives two days of actual hands-on effort, its flow efficiency is 20%. The other eight days were spent waiting — waiting for code review, waiting for a dependency, waiting for a decision, waiting in a queue that nobody realized had grown.
Most teams are surprised by how low their flow efficiency is when they first measure it. Numbers in the 15–40% range are common, which means the majority of a task’s life is spent not being worked on. That’s not necessarily a sign that engineers are idle — it usually means that work is stuck between people, teams, or process steps. Flow efficiency makes that waiting visible in a way that cycle time alone doesn’t.
Cycle time tells you how long something took; flow efficiency tells you why it took that long.
A team with a two-week cycle time and high flow efficiency is working on genuinely complex problems that take sustained effort. A team with a two-week cycle time and low flow efficiency is spending most of those two weeks doing something other than making progress on the task — and that distinction is enormously important when you’re deciding what to fix.
Here are some questions to explore when flow efficiency is low:
- Where is work waiting the longest? Map the stages a task moves through — development, review, QA, staging, deployment — and look at how long it sits in each. You’ll often find that one or two handoff points account for most of the wait time. Those are your highest-leverage improvement targets.
- Are reviews creating a bottleneck? Manual code review is one of the most common sources of wait time. If reviews routinely sit for a day or more before someone picks them up, that delay compounds across every task. This is often a cultural problem more than a capacity problem — teams that treat review as a shared priority rather than an interruption tend to have dramatically better flow.
- Is work being handed off between teams? Every handoff introduces a queue. If a task needs to move from one team to another for integration, security review, or infrastructure provisioning, each of those transitions adds wait time that neither team fully sees. Cross-team dependencies are one of the fastest ways to destroy flow efficiency.
- Are we batching things that don’t need to be batched? Sometimes work waits simply because a downstream step operates on a schedule rather than on demand. Deployments that happen once a week, review meetings that happen every Tuesday, or approval processes that run in batches all introduce artificial wait time that has nothing to do with the actual effort required.
- Is context switching masking the problem? When engineers juggle several tasks, each individual task spends time idle while the engineer works on something else. This shows up as low flow efficiency even when the engineer is fully occupied. It’s one more reason to keep WIP in check — not just for throughput, but because high WIP mechanically depresses flow efficiency for every task in the system.
One practical note: measuring flow efficiency precisely requires tracking not just when a task starts and finishes, but also when it transitions between active and waiting states. Many issue trackers don’t capture this cleanly, and the data can be noisy. Don’t let measurement difficulty stop you from thinking in terms of flow efficiency, though. Even a rough estimate — asking your team “what fraction of a task’s life do you think is spent waiting?” — tends to surface useful insights and provoke good conversations.
Some measures to avoid
Historically, agile teams have tracked velocity or story points. Originally meant as a way to help teams get better at splitting work and shipping value, these units have been abused ever since as a way to directly compare teams and steer an organization toward output-based thinking.
If talking about story points helps you be more disciplined about limiting queue depth and WIP, go for it. If not, don’t feel bad about dropping story points as long as you understand your cycle times.
Another traditional management pitfall is to focus on utilization, thinking that you want your engineers to be 100% occupied. As utilization approaches 100%, cycle times shoot up and teams slow down. You’ll also lose the ability to handle any reactive work that comes along without causing major disruptions to your other plans.
The explosion of AI in software engineering has led businesses to scramble to find ways to measure its impact, and this has led the industry to revisit metrics like lines of code (LOC) or create new metrics like suggestion acceptance rate. LOC has never been a good metric, and AI hasn’t changed that: focusing on lines of code incentivizes larger batch sizes, which are anti-productive.
Suggestion acceptance rate may be a good measure when you’re evaluating tools, but it tells you nothing about AI’s impact on quality, stability, or velocity.
When it comes to AI, we’re convinced that any impact it’s having will appear in the metrics detailed above.
There’s a time and place to look at metrics around individual engineers. In very healthy environments, they can be used to improve the quality of coaching conversations while understanding the shortcomings of these measures. In a bigger organization, an effort to focus on individual metrics will likely derail your good intentions around data-driven continuous improvement. Engineers will rightfully point out how the number of daily commits doesn’t tell you anything about how good they are at their jobs.
On the other hand, opportunities abound at the team level without shining a spotlight on any individual. Start your conversations there instead.
Metrics beyond web software
These metrics map cleanly to teams building web backends and services, where deployment is cheap, frequent, and instantly available to all users. But many engineering organizations build mobile apps, embedded, firmware, or some combination of the three. The underlying principles — small batches reduce risk, fast feedback improves quality, recovery capability matters — hold everywhere. The metrics themselves need adaptation.
Mobile software
The core tension with mobile is that you don’t control distribution. App Store and Google Play reviews introduce delays, users don’t install updates immediately, and you can’t roll back a bad release the way you can with a web service.
The practical workaround most teams land on is to measure against an internal or beta release channel rather than the public store. Create an internal release for every change that passes CI and QA checks, and calculate deployment frequency and change lead time against that channel. Track the full app-store lead time separately to maintain visibility into your public release cadence.
Each metric needs slightly different thinking in a mobile context:
Deployment frequency becomes less interesting when you’re on a fixed weekly or biweekly release train — there’s not much to optimize. What matters more is throughput into your development branch: how many changes are merging per cycle, and is that rate healthy?
Change lead time measured end-to-end (commit to App Store availability) includes store review time you can’t control. Split it: time through your internal pipeline (which you can optimize), and time through the store (which you track separately, flagging weeks where a release was delayed because the app wasn’t in a releasable state).
Change fail percentage is harder to measure because you can’t hotfix instantly, and only a portion of your users may ever install a bad version. A more practical measure: how many hotfix releases did you ship outside your normal cadence, and how many planned releases were delayed because of quality issues found in beta?
Recovery time is where mobile diverges most sharply from web. A backend hotfix is instantly available to all users; a mobile hotfix has to clear store review and then wait for users to update. This is why feature flags and kill switches aren’t optional infrastructure in mobile — they’re your primary recovery mechanism. Define recovery as the point when no new users are experiencing the degraded experience, whether that’s via a new binary or a server-side toggle.
Embedded and firmware
Embedded teams already know their delivery constraints are fundamentally different from cloud-native software: hardware dependency, cross-compilation toolchains, real-time requirements, regulatory traceability, and the fact that a bad deployment can brick devices in the field rather than return a 500 error for a few minutes. Applying traditional metrics uncritically to this context will produce misleading conclusions. A team on a six-week release cycle isn’t necessarily a “low performer” — they might be building brake controllers under ISO 26262.
That said, the thinking behind measurement is just as valid here. The question is where to apply it.
Separate your internal pipeline metrics from field deployment metrics. The most useful measurements in embedded track how quickly a change moves from commit to “ready for release” — through build, automated test, hardware-in-the-loop validation, and compliance checks. This is the part of the process your team controls and can improve iteratively, regardless of how constrained your actual deployment cadence is.
For teams with over-the-air (OTA) deployment capability, treat fleet deployment as its own measurement domain. Track OTA-specific metrics that don’t exist in web contexts: what percentage of targeted devices successfully update, how long full fleet adoption takes, and how often a rollout is paused or rolled back. Staged rollouts, rollback-capable bootloaders, and cohort-based deployment are the embedded equivalents of blue-green deployments and feature flags. Recovery time in this context might be measured in days rather than minutes, and that’s fine — what matters is whether it’s improving and whether you have the infrastructure to limit blast radius.
For teams without OTA or with heavily constrained update paths, DORA’s delivery metrics are mostly inapplicable to the deployment phase. But the upstream metrics still carry weight: build success rates, time from commit to validated artifact, the rate at which changes integrate cleanly, and how often hardware test failures are caught before release. The goal is the same as it is everywhere else — shorten feedback loops wherever you can within the constraints of your domain.
Regulatory process gates are real, but they’re not an excuse to stop improving. Teams in safety-critical domains sometimes use compliance as a reason not to change anything about their process. But the time spent generating traceability evidence, preparing audit documentation, and waiting for manual approvals is exactly the kind of process overhead that DORA thinking can help address — through automation, not elimination. The constraint is the requirement; the implementation of that constraint is yours to optimize.
Improving productivity
If you’ve been reading the diagnostic questions throughout this chapter — the ones embedded in each metric discussion — you’ve already encountered most of the levers for improving productivity. They tend to cluster around a few recurring themes: automate what’s manual, shrink what’s large, shorten the distance between action and feedback, and remove the process bottlenecks that force people to wait.
These themes aren’t independent. A team that automates its deployment pipeline will naturally start deploying smaller changes, because the cost of each deployment drops. Smaller deployments produce faster feedback because there’s less to debug when something goes wrong. Faster feedback builds confidence, which encourages the team to deploy more often. This is the positive cycle that DORA’s metrics are designed to reveal — and it’s why improving one metric in isolation rarely works. The leverage comes from recognizing that these improvements reinforce each other.
Where to start
The temptation is to start with whatever’s most visible or most annoying. Sometimes that works, but a more reliable approach is to follow the work.
Pick a recent piece of delivered value — a feature, a fix, something that shipped — and trace its path from idea to production. Where did it wait? Where did a human have to do something that a machine could have done? Where did batch size introduce risk or delay? Where did someone need information they didn’t have?
Alternatively, you can trace the same path backwards. Doing this can help uncover some (potentially incorrect) assumptions about what happens as work moves downstream. So instead of asking, “what happens next?”, you can ask things like “how did this work arrive?” or “what happened immediately before you took over this work?”
This exercise almost always surfaces a small number of high-impact problems, and it has the advantage of grounding the conversation in something concrete rather than abstract metrics. Engineers tend to engage more readily with “here’s what happened to this specific piece of work” than with “our lead time is too high.”
Quick, visible wins are useful for gaining organizational buy-in, but these value stream wins will ultimately be the most valuable.
Team-level improvements
Individual teams have more control over their own productivity than they sometimes realize. The most effective team-level improvements tend to involve how the team organizes its own work and how team members collaborate with each other.
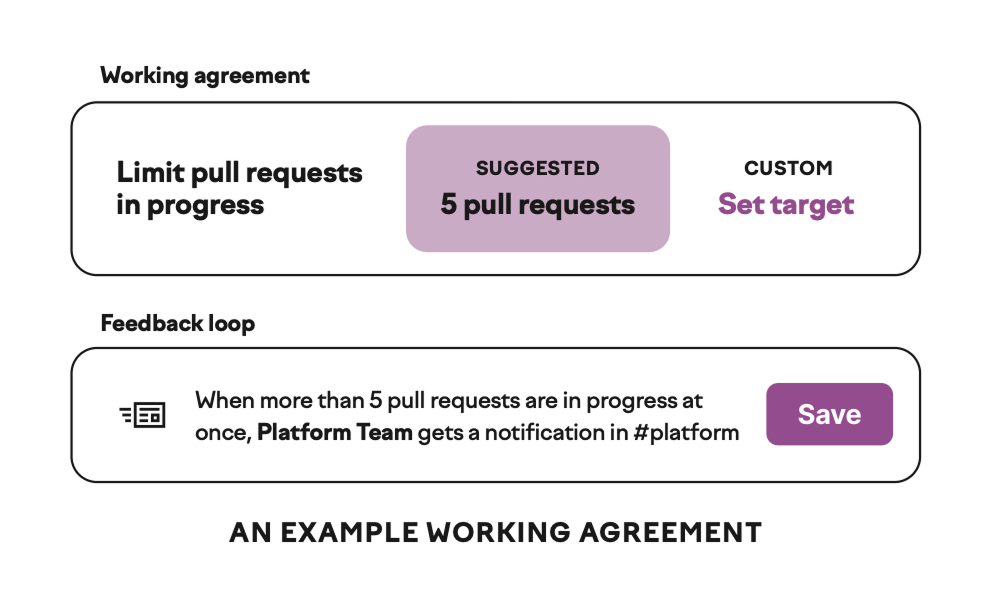
Working agreements make expectations explicit. When a team agrees that code reviews will be completed within a few hours of assignment, or that no one starts new work while a teammate is blocked, those agreements create accountability that doesn’t depend on a manager noticing. The value comes from the act of the team deciding together how they want to work and then holding themselves to it.
Retrospectives close the feedback loop on those agreements. A team that regularly examines how well it’s working — what went smoothly, what didn’t, what they want to change — builds the habit of continuous adjustment.
Productive retrospectives produce specific, owned action items rather than vague aspirations, and they follow up on previous action items rather than letting them disappear.
Beyond process, teams can often make significant gains by investing in their own tooling and automation. A team that writes a script to automate a tedious deployment step, improves its test data setup, or creates a runbook for a common operational task directly reduces the friction that slows future work. These investments are small individually but compound over time, and they don’t require permission or budget from anyone outside the team.
Collaboration patterns matter more than most teams acknowledge. When work gravitates toward solo efforts — one engineer per epic, with handoffs only at review time — the team loses the benefits of shared context and real-time problem-solving. Practices like pairing on complex problems, swarming on blocked work, and breaking features into slices that multiple people can work on concurrently tend to improve both throughput and knowledge distribution. This can feel slower at the individual level while being faster at the team level — a tension worth naming explicitly.
Organizational improvements
Some productivity problems can’t be solved by any single team because they originate in shared infrastructure, cross-cutting processes, or organizational design decisions.
The most common organizational bottlenecks fall into a few categories. Shared infrastructure that’s slow or unreliable — CI pipelines, build systems, test environments, deployment tooling — taxes every team that depends on it. Cross-team dependencies that require coordination, handoffs, or approval gates introduce wait time that no amount of team-level discipline can eliminate. And organizational processes that made sense at a previous scale or in a previous context — review boards, change advisory processes, manual compliance checks — sometimes persist long after the conditions that justified them have changed.
Addressing these requires leadership attention and often involves difficult prioritization. Investing in CI/CD reliability means someone isn’t building a feature. Restructuring teams to reduce cross-team dependencies means navigating organizational politics. Streamlining approval processes means having honest conversations about risk tolerance. These tradeoffs are uncomfortable, but ignoring them means accepting a permanent drag on every team in the organization.
The payoff, though, tends to be disproportionate. When you fix a shared bottleneck — say, reducing a flaky CI pipeline from a 20% failure rate to 2% — every team that uses that pipeline gets faster. That kind of leverage is rarely available at the team level.
Who owns this?
Once you reach a certain size, it’s useful to be explicit about who is accountable for developer productivity. If your immediate response is “everyone,” either you’re still a relatively small organization or it’s time to start thinking about a more definitive answer. Someone — whether it’s a dedicated team, a rotating responsibility, or a specific leader — needs to own the cross-cutting work that no individual team will prioritize on its own. Without that ownership, organization-level improvements tend to stall indefinitely, because everyone agrees they matter and no one is responsible for making them happen.
Setting productivity goals
If you’re just starting out on your productivity journey, goal-setting can feel intimidating, especially if you’re trying to prove the value of investing in this area. It can be tempting to go straight to frameworks like DORA and SPACE and try to set goals around those concepts. Still, you’ll have more luck if you identify a single opportunity from your conversations with engineers and execute on it (we’ll talk more about this in the final chapter).
For example, if you learn that CI builds fail 20% of the time due to seemingly random environmental issues, that’s a concrete data point to measure and set a target around. Once you hit the target, you can ensure you’ll notice if you exceed it again. Rinse and repeat the process with different metrics for different kinds of improvements.
Once you’ve embraced that pattern, it’s a good time to get DORA metrics in place if you haven’t already and start using them to track the impact of improvements on teams and services. In many ways, DORA metrics are an implementation of the SPACE framework covering performance, activity, and efficiency and flow.
As your productivity journey progresses, DORA’s software delivery metrics will continue to be useful for tracking trends, but they will never tell your whole productivity story. As you start to recognize themes in your work and your users’ reported issues, embracing SPACE more thoroughly will make sense. The SPACE framework is best used to identify various indicators of overall productivity, from OKR/goal attainment to meeting load to cross-team collaboration burden.
Setting goals around SPACE pillars is also fraught; there’s no way, for example, to boil efficiency and flow down to a single number. On the other hand, SPACE is great as a framework to classify problems and brainstorm specific metrics you might use to track trends and validate improvements.
Quality metrics deserve their own goals, but be cautious: setting targets around the number of bugs, incidents, or rollbacks can have unintended consequences when people choose not to report adverse occurrences rather than risk missing a target. SLOs work well for services, though they’re less natural for products with end users. Still, you can set objectives for what your users should expect of your product or service — response times, data freshness, error rates — and track whether you’re meeting those commitments.
The key is to frame quality goals around the experience you’re trying to provide rather than the problems you’re trying to count.
You’ll sometimes find yourself pressured to set a goal before you know how you’re going to solve the fundamental problem. Even under pressure, set goals around potential valuable outcomes from working on the problem, not on a restatement of the problem itself.
Productivity and quality
The discussion so far has focused on the speed and flow of delivery. But as you’ve probably noticed from the diagnostic questions in each metric section, productivity improvements and quality improvements are often the same work.
Productivity and quality are often treated as competing priorities — the assumption being that you can move fast or you can be careful, but not both. DORA’s research tells a different story. Two of its five metrics — change fail rate and failed deployment recovery time — are explicitly quality measures, sitting right alongside change lead time, deployment frequency, and deployment rework rate. They aren’t separate concerns that happen to share a dashboard; they’re structurally linked. Organizations that improve their deployment frequency and lead time almost invariably do so by investing in the quality automation that drives down failure rates and recovery times. You can’t sustainably deploy more often if your deployments keep breaking, and you can’t reduce lead times if every change requires extensive manual verification before it’s safe to ship.
Put differently, if you set out to improve your DORA productivity metrics, you’ll find yourself solving quality problems — building better test infrastructure, automating deployments, investing in rollback capabilities. The path to faster delivery runs directly through more reliable delivery.
Quality doesn’t happen by accident. It emerges from deliberate architectural and product direction choices, investment decisions, and engineering practices.
Architecture profoundly shapes quality outcomes. Well-designed systems isolate failures, make problems observable, and support incremental changes. Poorly designed systems make every change risky and every problem a mystery. Investment in architecture pays dividends over the lifetime of a system, even though it can be difficult to justify in the short term.
Keeping a healthy balance of investment between new features, keeping the lights on (KTLO), and improving the system is crucial to sustaining quality over time. If your organization pours all its resources into new feature development, it will accumulate technical debt that eventually slows you down. Teams need dedicated capacity to address quality issues, reduce complexity, and improve tooling.
Non-functional requirements deserve the same level of intentionality as feature requirements. Performance targets, reliability expectations, and security standards should be explicit and agreed upon, not afterthoughts. When these requirements exist only implicitly, they tend to be the first things sacrificed under deadline pressure.
What is quality?
Quality in software is multidimensional, and different organizations will weigh these dimensions based on their own product and user needs. Quality is ultimately about answering the following questions: does our software do what users expect, and does it continue to do so over time?
Of course, quality isn’t just about features. Does your system protect user data and resist unauthorized access? As software becomes increasingly interconnected, security vulnerabilities in one system can cascade across many others. Privacy goes beyond security to address how you handle, store, and use data — users increasingly expect transparency about what data you collect and control over how it’s used.
Users have little patience for slow software; they expect high speed, low latency, and responsiveness. Poor performance often manifests as lost revenue or engagement. Customer experience reflects how well your software serves its intended purpose from the user’s perspective, including everything from intuitive design to reliable functionality to accessible interfaces.
Your software needs to do what it’s supposed to do, and do it correctly. Bugs, edge cases, and unexpected behaviors all erode functionality. This seems obvious, but it’s easy to lose sight of basic correctness when teams are focused on shipping features quickly.
If your system’s health depends on one or two people who understand its intricacies, you’ve built organizational risk into your technical architecture. Can a new team member contribute meaningfully? Can existing team members work across different parts of the system? Code that only its author can maintain is a liability, regardless of how clever it might be.
Finally, there are paper cuts — the minor issues that don’t individually warrant urgent attention but accumulate over time. A button that’s slightly misaligned, a confusing error message, a workflow that requires one more click than it should.
Paper cuts — while trivial in isolation — collectively shape the user’s perception of your product.
Why quality matters
Quality issues have consequences that compound over time.
Users who encounter bugs, experience slowness, or feel frustrated by rough edges will eventually leave — often without telling you why. The cost of acquiring a new customer typically far exceeds the cost of retaining an existing one, which means quality problems become revenue problems. Retention and churn are directly tied to the quality of the product experience.
Developer experience also suffers when quality is neglected. Engineers working in codebases riddled with bugs, unclear behavior, and fragile systems spend their time firefighting rather than building. This affects both productivity and morale, and teams that ship low-quality code often find themselves trapped in a cycle of fixing problems they created rather than delivering new value.
The relationship between quality and speed is often misunderstood. Teams that sacrifice quality for velocity usually end up slower, not faster, as technical debt accumulates and each change becomes more difficult and riskier.
Code quality in the era of AI-assisted development
AI-generated code is naive by default. It follows familiar patterns, uses reasonable-seeming APIs, and compiles — but it doesn’t know the conventions of your codebase, the edge cases specific to your domain, or the decisions your team made three years ago after a painful production incident. The defects it introduces are harder to spot in review precisely because the code reads as professional.
Making AI-generated code smart is your job. Agent configuration files, repository-specific instructions, custom rules, and retrieval over internal documentation can meaningfully narrow the gap between generic LLM output and code that looks like it came from someone on your team. Pre-commit hooks, stricter linters, and type checkers set to unforgiving settings catch a layer of issues before human review. Test-driven development is proving especially valuable: it forces meaningful tests to be written first, rather than writing tests that validate what the agent already produced.
Think of this as building the system that delivers your product. Every improvement you make to your platform — better test coverage, faster CI, clearer documentation, agent skills files — compounds across every engineer and every agent on your team. Did you just spend two hours guiding a coding agent around your codebase? Document it in an agent skill so your colleague has an easier time tomorrow.
When this system works well, teams can compress months of output into weeks. That’s a significant compression — but it comes with a side effect that catches people off guard. If you complete two months of work in one week, you’re also surfacing two months’ worth of bugs in one week. It feels like everything is falling apart, but objectively, spending one week building and one week stabilizing something that used to take eight weeks is a great deal. Especially when many of those bugs wouldn’t have surfaced pre-production, no matter how much time you spent on the implementation.
Teams feel the volume pressure most acutely in code review. More code means more reviews, and the instinct is to drop reviews or wave things through to keep up. That’s the wrong response.
Code review is one of the few places where a human who understands the system can make judgment calls that tools still can’t.
Whether this is the right change to make, whether it composes well with the rest of the system, whether the tradeoffs are ones the team wants to live with — those are judgment calls, not checklist items.
The better path is to build your review capacity rather than abandon it. Automated review bots can handle specific risk areas — database migrations, security patterns, architectural consistency — so human reviewers can focus on higher-level concerns. Just as linters helped us move past a whole category of style nitpicking, AI-assisted reviews can move the conversation from “did you handle this null check” to “is this the right data model” and “does this feature actually make sense.”
None of this works without a cultural expectation that people take real responsibility for what they ship. “AI wrote it” is not a valid excuse for shipping broken code. If you’re presenting AI-generated output for your team to review without reading it yourself, code review becomes an extremely frustrating process for everyone involved. The expectation should be that engineers understand what they’re shipping, challenge each other in planning and review, and are comfortable discarding code that doesn’t clear the bar.
A senior engineer reviewing AI-generated code will catch what a junior approves without reading. Juniors should absolutely be using AI tools, but the team needs to invest in their growth and be realistic about review quality in the meantime. If you’ve built a culture of quality and ownership before adopting AI tools, you will find that AI amplifies those strengths. If you were getting by on low throughput and careful engineers, you’ll discover that higher throughput exposes every practice you skipped.
Embedding quality into your practices
Quality doesn’t come from a final inspection before release: it’s an outcome of how teams work every day — the habits, expectations, and tradeoff decisions that shape what gets built and how carefully it’s built. If quality only gets attention when something breaks, you’ll always be reacting.
The most effective starting point is usually code review, if you use it as a genuine engineering conversation. Reviews that focus only on style or syntax miss the point; good reviews ask whether the change is correct, whether it handles failure gracefully, and whether the approach will be maintainable by someone who didn’t write it. When teams treat reviews as an opportunity to learn and catch problems rather than a mandatory bureaucratic step, the quality of the code they produce goes up — and so does the collective understanding of the system.
Testing is the other foundational practice, and it works best when it’s inseparable from development rather than something that happens afterward. Engineers who write tests alongside their code tend to design more testable systems, catch their own mistakes earlier, and produce fewer surprises in production. The specific testing strategy matters less than the consistency: a team that reliably writes good tests for every change will outperform a team with a theoretically superior testing philosophy that’s applied unevenly.
Pair programming and collaborative problem-solving are underused quality tools. Two people working through a complex problem together will typically produce a better result than one person working alone and submitting the result for review after the fact. Not every change warrants this — routine work doesn’t need two people — but for high-risk or high-uncertainty work, the investment pays for itself in fewer defects and better design decisions.
Quality doesn’t come from a final inspection before release: it’s an outcome of how teams work every day.
Having design conversations before code is written can prevent entire categories of quality problems. When teams discuss the approach to a nontrivial piece of work — even informally or briefly — they surface assumptions, identify risks, and align on tradeoffs that would otherwise become bugs or rework. This doesn’t mean heavy upfront specification; a fifteen-minute conversation at a whiteboard can save days of fixing the wrong approach.
Technical debt management also needs to be a deliberate practice rather than something teams hope to get to someday. This means regularly identifying areas of the codebase that are causing disproportionate pain — frequent bugs, slow development, difficult onboarding — and making space to address them as part of normal work. Teams that treat tech debt reduction as a separate initiative that competes with feature work tend to repeatedly lose that competition. Teams that fold it into their regular cadence, allocating a predictable share of their capacity, actually make progress.
Finally, quality culture is reinforced by how teams respond when things go wrong. Blameless postmortems that focus on systemic causes rather than individual mistakes encourage people to surface problems honestly and invest in preventing recurrence. When the response to an incident is “how do we make sure this can’t happen again?” rather than “whose fault was this?”, engineers are more willing to take the kinds of measured risks that lead to better software.
A separate manual QA phase — where work is handed off to a dedicated testing team or individual after development is “done” — is one of the most persistent antipatterns in software delivery. It introduces a handoff that adds wait time, creates a false sense of security (“well, QA will catch it”), and distances the people who wrote the code from the responsibility of making sure it works. It also creates a bottleneck that gets worse as the team grows: the more engineers you add, the more work piles up waiting for the same QA capacity.
None of these practices are novel. Quality in software comes from the disciplined, consistent application of fundamentals, not from a clever process or a new tool. These practices become so routine that they’re just … unremarkable, basic things.
Ensuring quality in software delivery pipelines
The most important principle for ensuring quality is this: if you want to get something done consistently every time, it needs to be done by machines instead of humans. Every manual step between merge and production is an opportunity for delay, inconsistency, and error. Our goal is to produce consistent, predictable results.
Automated tests are the foundation for this. When tests run automatically on every change, they catch regressions before they reach production. This requires investment in test infrastructure, test data management, and a culture that values test coverage. The goal isn’t to eliminate all manual testing but to automate the regression testing that would otherwise slow you down.
Fast, automated deployments make deploying a non-event. When deployment is trivial, teams deploy more frequently and with smaller changes, and problems become easier to isolate and roll back.
Infrastructure as code extends the benefits of version control and automation to your operational environment. When infrastructure is defined in code, it can be reviewed, tested, and deployed with the same rigor as application code. This means changes to production environments become traceable and reproducible, too.
Think of deployment as the assembly line of software development. In manufacturing, the assembly line is where quality is built in — through standardized processes, quality checks at each station, and clear visibility into what’s happening. Your deployment pipeline serves the same function. It’s where you ensure that only code meeting your quality bar reaches production.
Merge queues help maintain the integrity of your main branch by ensuring that changes are tested against the current state of the branch, not the state when the pull request was opened. This prevents the common scenario where two changes are individually fine but problematic together.
Blue-green deployment setups decrease the impact of rapidly detected issues by always keeping a new and old version available and using a load balancer to decide how much traffic to send to each.
Measuring quality
Quality manifests through several observable signals, though none of them tell the whole story on their own.
Bug reports and incident frequency tell you how often things go wrong. Track not just the count but also the severity — a high volume of minor issues signals different problems than occasional catastrophic failures. Incident response metrics like failed deployment recovery time indicate how quickly you can restore service when problems occur, while change fail rate shows how often deployments introduce problems.
These problems create a steady stream of reactive work. Firefighting is not just time away from roadmap work; it’s also taxing on the teams and often needs to happen immediately. If you’re following your investment balance, you should pay attention to the share of KTLO work.
Service-level objectives and indicators (SLOs and SLIs) formalize your quality commitments. An SLI might measure the percentage of requests that complete within 200 milliseconds; an SLO sets the target you’re committing to maintain. These create shared language between engineering, product, and the business about what “good enough” means.
Test coverage is a useful but imperfect proxy. High coverage doesn’t guarantee quality, but very low coverage almost certainly correlates with problems. More useful is understanding what kinds of tests you have and whether they’re catching the kinds of issues you see in production. And more interesting, oftentimes, is knowing whether tests are being written consistently alongside pull requests.
Perhaps the most telling signal is deployment confidence — whether your team feels comfortable shipping changes. If engineers dread deployments or avoid deploying on Fridays, it’s a signal that your quality infrastructure isn’t providing the safety net it should.
Change fail rate
Change fail rate (CFR) measures the share of deployments that result in a degraded service — requiring a rollback, hotfix, or patch. Note that this doesn’t mean everyday bugs: change fail percentage counts when a deployment broke something in production, such that a fix couldn’t wait for the next regular deployment cycle.
It’s a quality metric that sits in healthy tension with deployment frequency: teams that deploy more often have more opportunities for things to go wrong, but they also tend to deploy smaller changes that fail less catastrophically and recover more quickly.
A high change fail rate often signals problems upstream of deployment. Here are some questions to explore when this number climbs:
- What does our test coverage look like, and do we trust it? If engineers don’t trust the test suite to catch real problems, they’re deploying with fingers crossed. If you’re catching issues in production that automated tests should have flagged, your test infrastructure needs investment.
- How thorough is our code review process? Reviews that focus exclusively on style or nitpicks while missing logical errors or edge cases aren’t serving their purpose. On the other hand, if reviews are so burdensome that engineers try to sneak changes through, that’s a different problem.
- Are we deploying large batches of changes? A deployment that bundles two weeks of work across multiple features is far more likely to introduce a failure than one that contains a single small change. If your change fail percentage is high, check whether your deployment frequency is too low.
- Do we understand the environments we’re deploying into? Failures sometimes come from environmental differences — between staging and production, between regions, or between configurations — rather than from the code itself. If your failures are environment-related, your deployment pipeline might not be testing against realistic enough conditions.
- Are failures concentrated in certain areas of the codebase? If most failures come from one service or one part of the system, that’s useful diagnostic information. It might point to architectural problems, insufficient domain knowledge on the team, or accumulated technical debt in that area.
It’s tempting to drive change fail percentage toward zero, but don’t do it at the expense of deployment frequency. A team that never fails because it never ships isn’t succeeding. The goal is to build enough confidence in your pipeline and processes that failures are rare, small, quickly detected, and easily resolved. Some failure is the natural cost of moving quickly, and the right response is almost always to invest in faster detection and recovery rather than to significantly slow down.
Failed deployment recovery time
Failed deployment recovery time (previously MTTR, or mean time to recovery) measures how long it takes to restore service after a deployment causes a problem. Where CFR tells you how often things go wrong, recovery time tells you how prepared you are when they do.
This metric matters because failures are inevitable. No amount of testing, review, or process will prevent every production issue. What distinguishes high-performing teams isn’t that they never fail but that failures are brief, contained, and minimally disruptive. A team that deploys a bad change and recovers in five minutes has a very different risk profile than one that takes four hours to get back to a working state — even if both teams fail at the same rate.
Recovery time is shaped by a combination of tooling, architecture, and organizational readiness. Consider these factors:
- Can we detect problems quickly? Recovery time starts when the problem is detected, not when it’s introduced. If you rely on user reports to discover production issues, your recovery time includes however long it takes a user to notice, get frustrated enough to report it, and for that report to reach someone who can act. Invest in monitoring, alerting, and anomaly detection that surfaces issues within minutes of deployment.
- Can we roll back quickly and safely? The fastest recovery is often a rollback to the last known good state. If your deployment infrastructure supports one-click or automated rollbacks, you can restore service while you investigate the root cause at a comfortable pace. If rolling back is a manual, multi-step process that requires senior engineer involvement, every failure becomes a fire drill.
- Do we know what changed? When a deployment causes a problem, the first question is always “what changed?” If your deployments are small and well-documented, the answer is usually obvious. If they’re large bundles of unrelated changes, debugging becomes a time-consuming process of elimination.
- Are on-call responsibilities clear and well-distributed? Recovery depends on the right people being available and empowered to act. If incident response relies on one or two people who happen to know the system, you’ve introduced a bottleneck that directly increases recovery time. Runbooks, shared on-call rotations, and broad familiarity with production systems all help.
- Is our architecture designed to limit blast radius? Systems that isolate failures — through service boundaries, feature flags, or canary deployments — can often contain problems to a subset of users or functionality rather than affecting the entire product. This doesn’t reduce recovery time in the strictest sense, but it dramatically reduces the impact of the failure while recovery takes place.
Teams with fast recovery times tend to share a common trait: they’ve invested in making recovery routine rather than heroic. When rolling back is easy, monitoring is comprehensive, and incident response is practiced, recovering from a bad deployment becomes an unremarkable operational task rather than an all-hands emergency. That confidence, in turn, feeds the same upward spiral we see across all the metrics we’re discussing here: more frequent deployments, smaller changes, fewer failures, and faster recovery, each reinforcing the others.
Quality antipatterns
Several common practices actively undermine quality, despite good intentions.
Over-specifying requirements too early attempts to guarantee quality through exhaustive upfront planning. In practice, this delays feedback, encourages large batches of work, and creates a false sense of certainty. Quality emerges through rapid iteration and learning, not through perfect planning.
Manual process overhead — pull request checklists, manual deployment gates, approval workflows — adds friction without proportional benefit. Each manual step is a point where work can stall, consistency can break down, and humans can make mistakes. If a check matters, automate it. If it can’t be automated, question whether it’s truly providing value.
“We can’t afford to slow down” is often invoked to justify skipping tests, rushing deployments, or ignoring technical debt. Paradoxically, this mindset almost always produces the opposite of its intended effect. If you skip quality work in the name of speed, chances are you’ll eventually slow to a crawl as you drown in the consequences of your shortcuts.
What’s next?
In this chapter, we discussed developer productivity, including ways to quantify it and guidance on goal-setting in the developer productivity space. We also covered the ways in which productivity and quality interact, and how they are not competing priorities so much as force multipliers of each other. Next, we’ll talk about the less quantifiable but equally important developer experience.
Further reading
- The Principles of Product Development Flow: Second Generation Lean Product Development, by Donald G. Reinertsen. A comprehensive guide on applying lean principles to software and product development, enhancing productivity and efficiency.
- The DevOps Handbook: How to Create World-Class Agility, Reliability, and Security in Technology Organizations, by Gene Kim, Patrick Debois, John Willis, and Jez Humble. Explains DevOps principles and practices with a focus on collaboration and productivity.
- Making Work Visible: Exposing Time Theft to Optimize Work & Flow, by Dominica DeGrandis. Focuses on the importance of making work visible to improve productivity and efficiency in software development.
- The Mythical Man-Month: Essays on Software Engineering, by Frederick P. Brooks Jr. A classic book in software engineering that discusses the challenges and pitfalls of managing complex software projects.
- DORA Research Program, by Google. The longest running academically rigorous research investigation in the developer productivity and developer experience space.
- The SPACE of Developer Productivity, by Dr. Nicole Forsgren et al. The white paper that describes the SPACE framework and the multidimensional nature of productivity.
- Develop, Deploy, Operate: A holistic model for understanding the costs and value of software development, by Titus Winters, Leah Rivers, and Salim Virji.