At some point, a board member is going to ask you something you don’t have a clear answer to. What’s the company getting from all this AI investment? Why did a competitor ship that feature first?
Deep breath. The answers are usually in your head — you just need a reliable way to translate what you already know into something the board can engage with inside a 20-minute slot.
This article walks through the seven things most software CTOs should cover in a board update, in the order they work best, and what to focus on for each. If you’d rather skip ahead to a deck, download the CTO board deck template here.
What do boards want from engineering?
Boards think in two currencies: risk and investment. Where is capital going, what could go wrong, and what do we plan to do if it does. Luckily, most engineering concepts translate into those two terms naturally with the right framing.
You see, “our test coverage is at 23%” means nothing to a board member unless they’ve got a software engineering background. For anyone without that context, it’s not clear if 23% is good, bad, or something in between. Clearing up that ambiguity with the aim of getting buy-in is your job.
Compare it to this: “We have a high risk of production incidents. It’s already cost us roughly one customer a month this year, and we want to invest 12 developer-months over the next two quarters to fix it.” Everyone in the room can engage with that. It’s the same underlying problem, but two very different conversations (and, potentially, results).
Seven things to include in a CTO board update
- Engineering investment: where capacity and cost went
- Software capitalization: what was capitalized and what was expensed
- AI adoption: use of tools and contribution of AI to the codebase/product
- AI impact and ROI: what AI cost and what it bought
- Operational excellence: delivery and reliability metrics, each with a rating
- Largest deliverables: what shipped and what it took
- What’s next: target dates and a conservative forecast
Start with framing, not a slide
Before your first slide, spend a minute on strategy. If your company runs OKRs or high-level goals, report engineering highlights against those, and show the movement if you’ve been tracking the same objectives across quarters.
For your biggest strategic engineering initiatives, connect the work back to those goals: what’s been completed, what’s in progress, what it’s costing, and what you expect it to deliver for the business.
1. Engineering investment
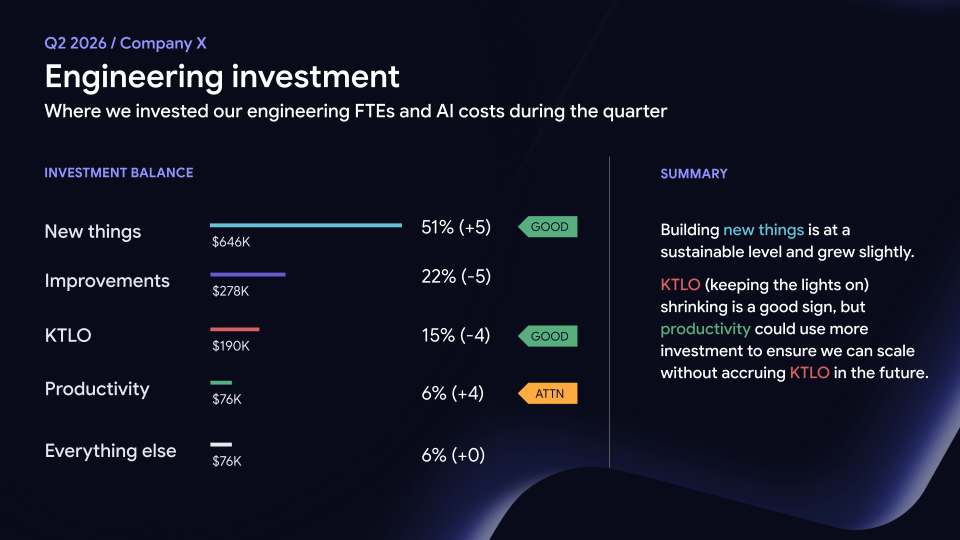
Early in the deck, answer one of the most important questions for the board: where did the engineering budget go?
Break the quarter’s effort into new development, improvements, keeping the lights on (KTLO), productivity work, and everything else — the balance framework is a reasonable starting point. Then present each category three ways: as a percentage of the quarter, as the change since last quarter, and in dollars.
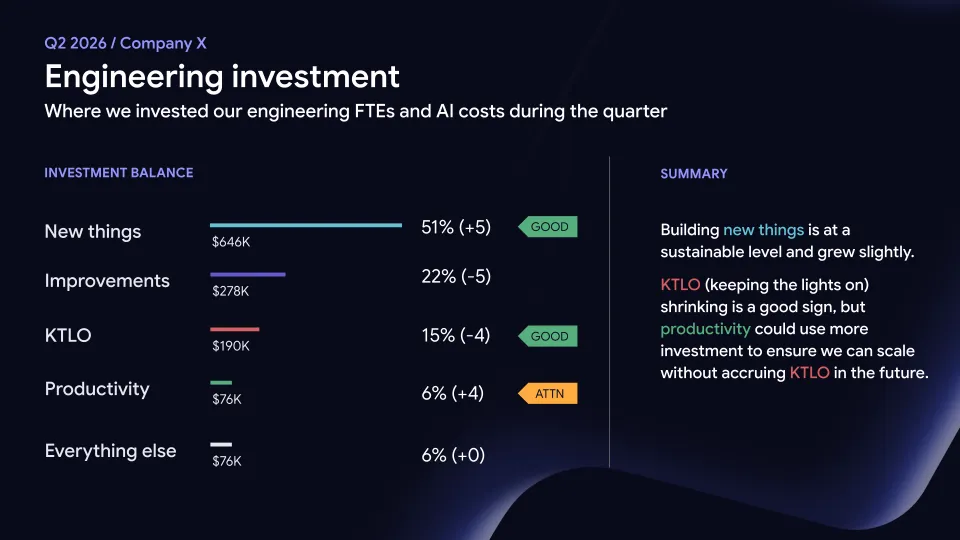
The dollar figures are what make this a board slide. Each category gets a benchmark as well as a value. A traffic light system is usually enough for the slide, but be ready to go deeper: if something moved from green to amber, you should know why, and have a plan.
Low investment in productivity work is good to highlight even when it looks harmless. It usually does look harmless in the quarter it happens, and then it can turn up as KTLO two quarters later. Give the board that context early (notice this advice become a trend in this article) and you’ll be far better off.
Headcount can live somewhere around here too, since it’s the same conversation. Team size and the delta since you last met, plus any structural changes — a reorg, a new platform team, a team split or merged. Boards usually ask about attrition. Report the rate, and separate out the regretted departures — those are the ones that will cost you delivery capacity before anyone notices.
One more thing if you’re scaling: you might hear why are we moving slower when we have more headcount? Adding engineers doesn’t linearly increase output, and the larger a codebase gets, the more capacity gets absorbed by maintenance, incidents, and coordination. As you can imagine, having the investment balance data to back you up can help a lot here.
2. Software capitalization
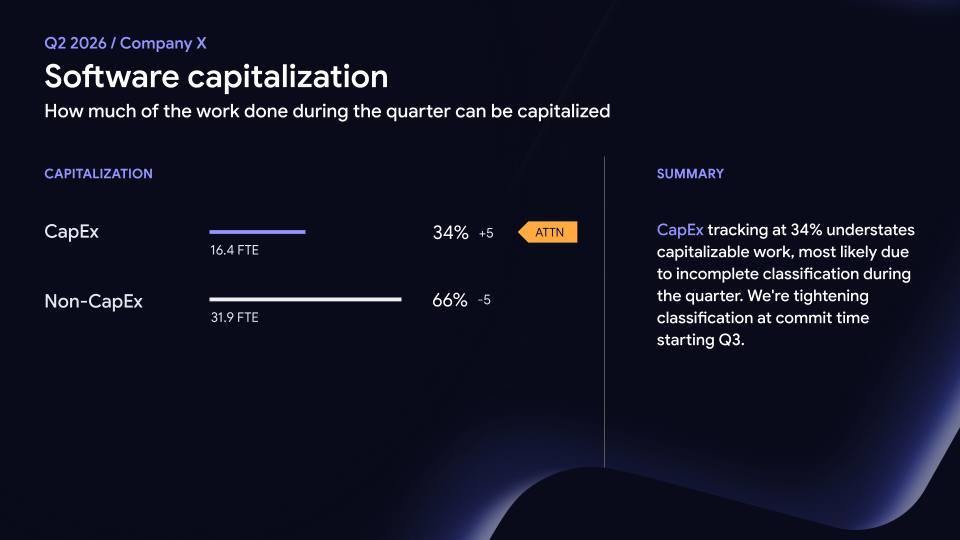
If your company capitalizes software development costs, the board needs to see how engineering work was classified.
Show the CapEx and non-CapEx split both as a share of the quarter and as FTEs (Full-Time Equivalents).
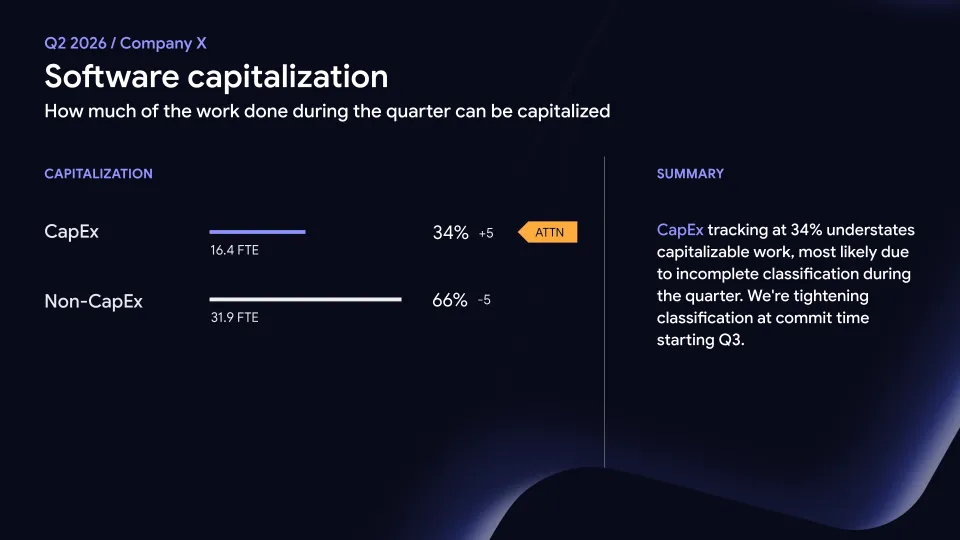
Align with your finance counterparts on the presentation before the meeting. The board will view this as a finance slide, and it needs to match what they’re seeing elsewhere in the pack.
3. AI adoption
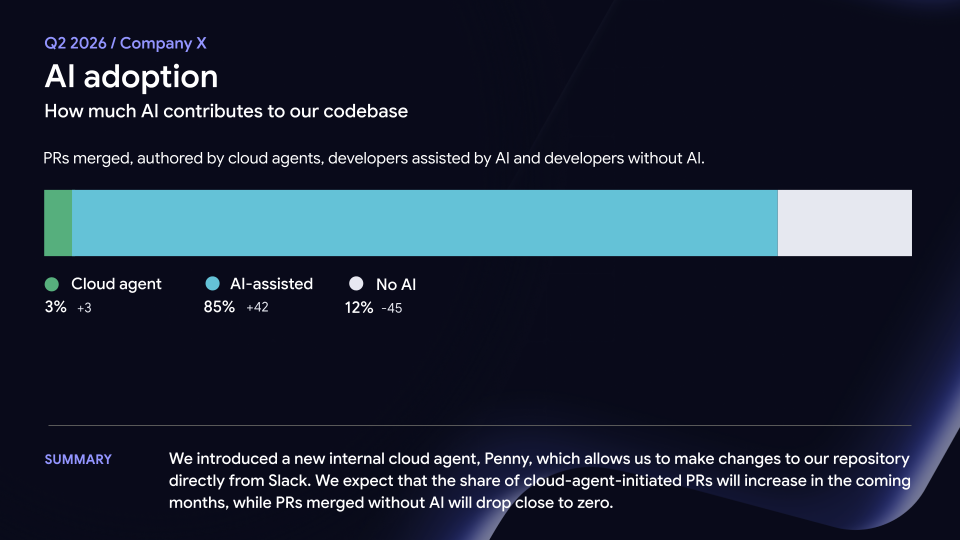
AI adoption lives in your codebase, not in your seat licenses.
Tool usage and weekly active users tell you people are logged in. The board is probably going to ask something more specific: is the AI output good enough to ship? So report the share of merged pull requests authored by cloud agents, the share written by developers with AI assistance, and the share with no AI involvement at all — each with the change since last quarter.
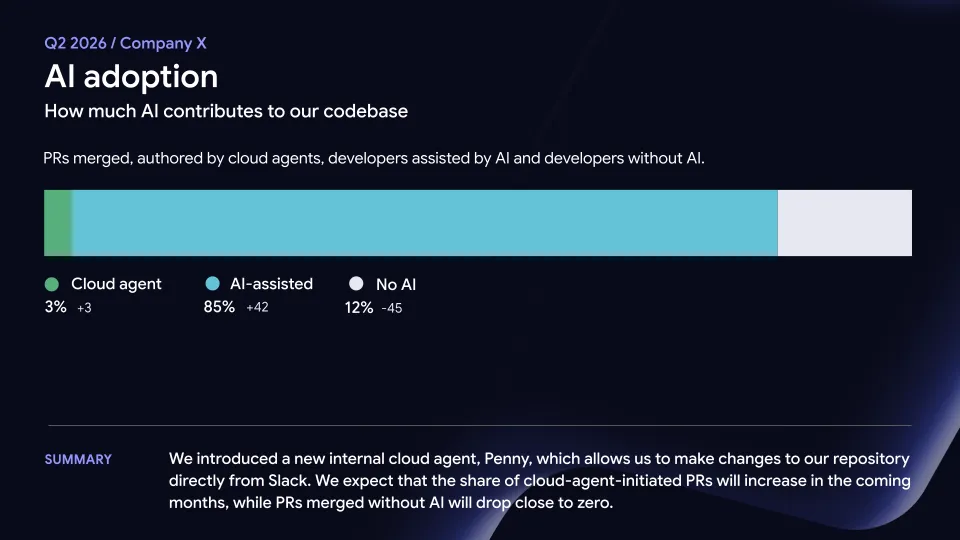
Watch the share with no AI. Once it’s heading toward zero, “are we adopting AI” isn’t an interesting addition to the deck, and the conversation will move to quality of output. And if the cloud agent share has moved, explain what changed: a new agent, a new integration, a new class of task handed over.
4. AI impact and ROI
Before you get into the ROI math, answer the bigger question: is AI actually helping engineering deliver more value?
Adoption by itself isn’t impact. Neither is generating more code. What the board ultimately cares about is whether the investment is translating into faster or better delivery — and, if it isn’t yet, whether you understand why.
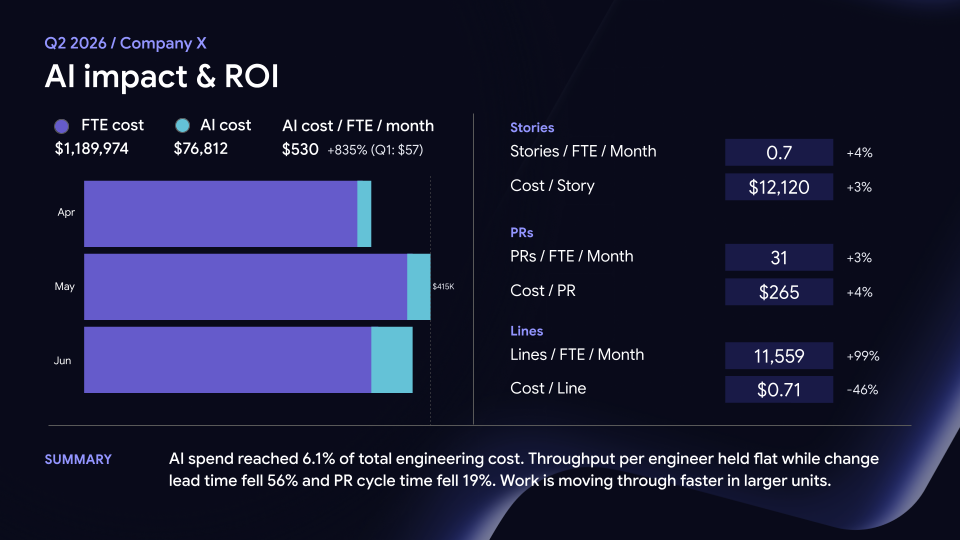
Then present the ROI math before someone in the room does it on the fly. Show AI spend next to FTE cost month by month, AI spend as a share of total engineering cost, and cost per engineer per month. You can also consider adding more granular metrics like cost per story, cost per pull request, cost per line, and throughput per engineer, each against last quarter.
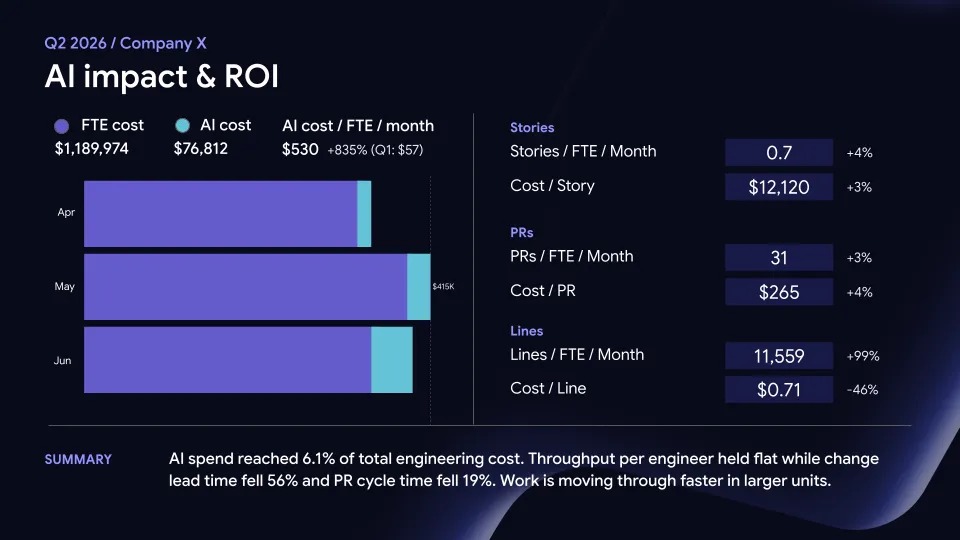
Always show the growth rate and the share together. If you’re trying to pull usage and spend across multiple tools into one view, AI adoption and cost is designed for exactly this problem. Early AI spend grows from a tiny base, so a huge percentage jump might look alarming on its own.
No single unit metric tells you much on its own. Read side by side, however, they can tell you what changed. For example, if cost per line falls sharply while cost per story stays flat and throughput per engineer holds steady, that suggests the same amount of work is happening, just in much larger diffs. It’s also why cost per line shouldn’t lead your discussion. Of the four unit metrics, it’s the most variable and the least indicative of value.
5. Operational excellence
Pick a small, consistent set of metrics and show the same ones every quarter.
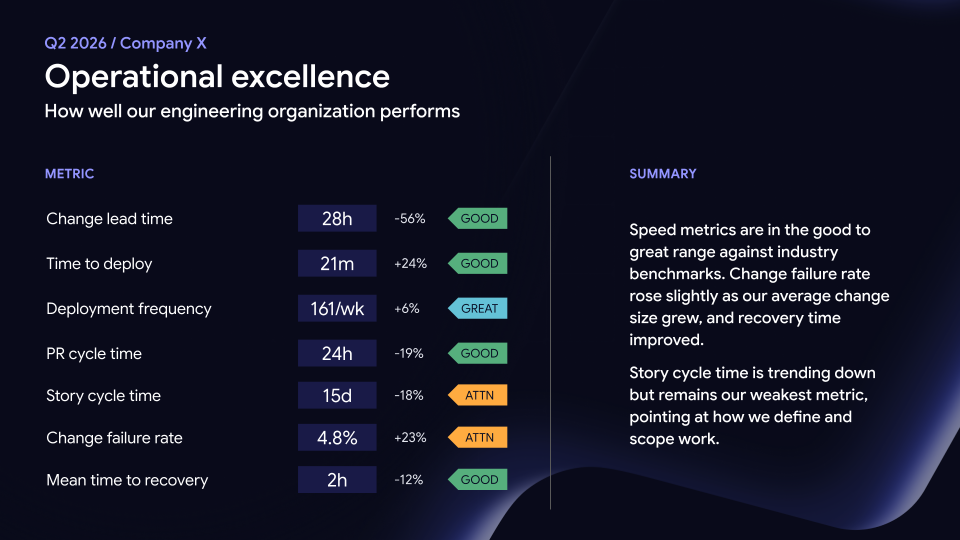
DORA metrics cover most of it — change lead time, deployment frequency, change failure rate, time to recovery — plus PR cycle time and story cycle time for the parts of delivery DORA doesn’t cover.
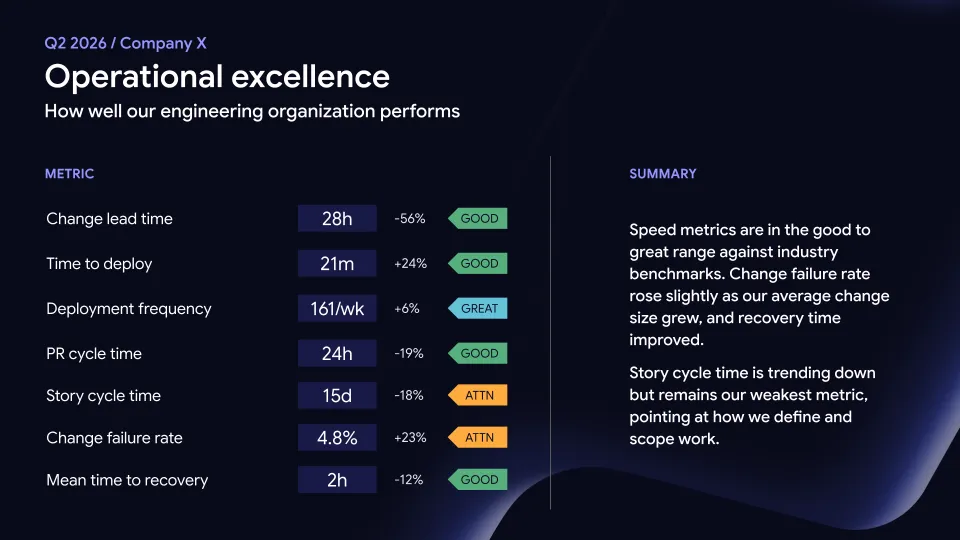
Boards ask “is this good?”, not just “what is the number?” A median cycle time with no benchmark will get you exactly one follow-up: compared to what? Which is what the benchmarks are for.
Where you can, translate one metric into business terms. “Change lead time roughly halved, which means a fix for a bug reported on Monday is in production the same week.”
The slide shouldn’t stop at diagnosis, though. If a metric is yellow or red, show what engineering is doing about it, whether that’s reducing change size, removing review bottlenecks, investing in reliability, or shifting capacity toward productivity work for X amount of time.
If you’re deciding which signals belong on the slide in the first place, our guide to engineering metrics for leaders goes deeper into the ones that are useful at the leadership level.
6. Largest deliverables
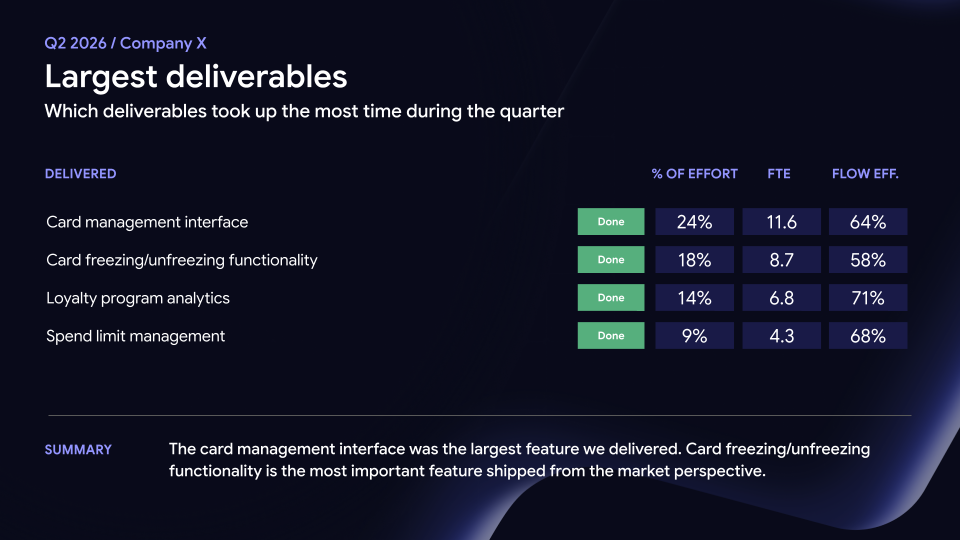
For each of the quarter’s biggest deliverables, show the share of total engineering effort, the FTE numbers behind them, and the flow efficiency. The first two answer what it cost in terms of effort, and flow efficiency answers whether the team made consistent progress towards the goal.
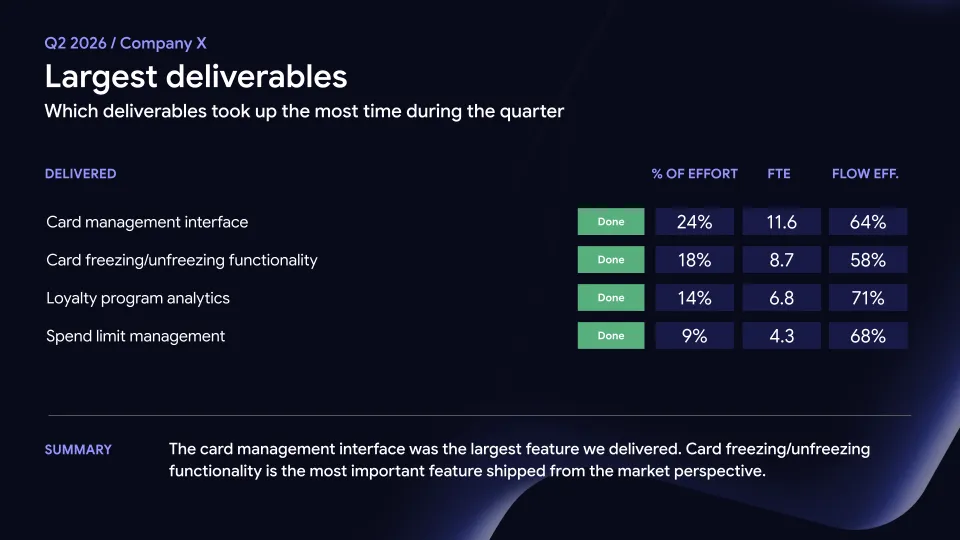
Flow efficiency deserves a sentence of explanation the first time it appears in front of a board. It’s the share of a work item’s lifetime spent actively being worked on, as opposed to sitting in a queue. A feature that took six weeks at 60% flow efficiency spent over two of those weeks waiting, and waiting is almost always a handoff, review, or dependency problem. So it’s a useful check on “we need more engineers”, because sometimes what you actually need is fewer dependencies.
This slide can be where you talk about what you chose not to build, too, which is arguably one of the more important judgment calls now that building is only getting cheaper.
7. What’s next
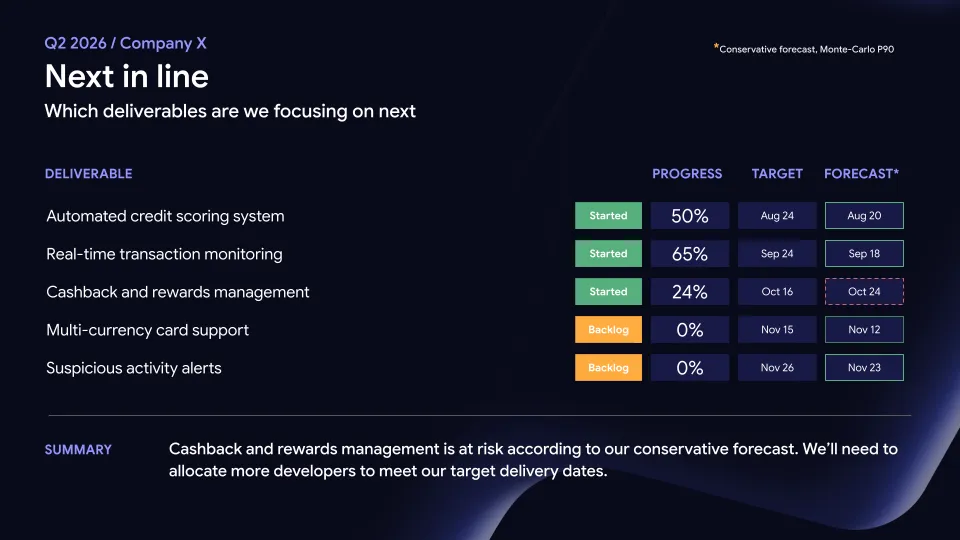
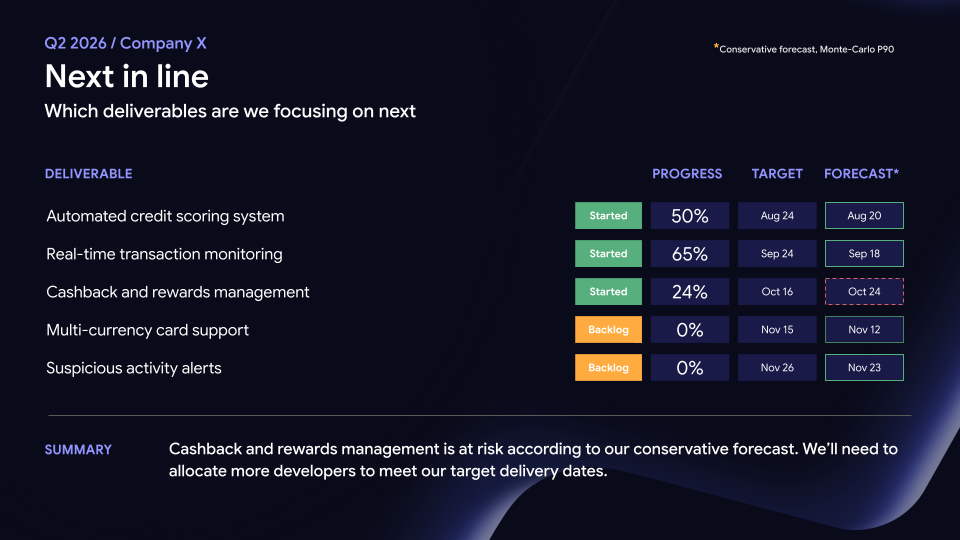
Every in-flight deliverable should get two dates: the target, and a conservative forecast. The target is what you committed to, and the forecast is what your throughput data says. When the forecast isn’t looking achievable, the item gets flagged early and you’re the one raising it, which is far better than a board member noticing a slipped deadline at the next quarterly meeting.
End with what you need. Boards exist to guide the organization and to lend their experience and network, so if there’s an ask, put it here:
- Tactical things, like introductions and advice. “We’re building an AI agent — do any of your portfolio companies have experience with this?”
- Budget and headcount requests. “We can build the X integration and expect to double conversion, but we’d need five additional engineers. Here’s the business case.”
Preparation is the presentation
An underrated benefit of a well-structured board update is all the work that happens before the meeting. Pulling one together forces alignment between the CTO, CPO, and CEO on product bets and engineering priorities. Disagreements that might otherwise go unvoiced tend to surface when you’re all looking at the same slides.
Use the same baseline structure every quarter. Your time with the board is limited and valuable, and they shouldn’t have to reorient themselves to a new format each time. Once they know where to look for what, they start tracking trends on their own and asking better questions — which is what makes the harder conversations easier later, when you need to explain a risky technical bet or make the case for more headcount.
Start early, too. If the first real briefing happens during a crisis, you’re asking the board to understand the problem and act on it in the same meeting.
And one last thing: board members are people, and people are great at going off on tangents. If you don’t control the flow, someone will find a word on a slide and spend your whole 20 minutes on it (taking bets on it being “AI spend” for the foreseeable future).
A clear structure and a specific ask at the end are your best tools for getting something useful to take back to the engineering org.
Here, we put it in a deck for you
Use this template to communicate how your engineering organization is doing — from investment allocation and delivery metrics to AI adoption and team performance.
Download now



'%20stroke='url(%23paint1_linear_110_4764)'%20stroke-width='0.5'/%3e%3cdefs%3e%3clinearGradient%20id='paint0_linear_110_4764'%20x1='19.651'%20y1='5.88916'%20x2='19.651'%20y2='27.8676'%20gradientUnits='userSpaceOnUse'%3e%3cstop%20offset='0.1'%20stop-color='%235549C2'/%3e%3cstop%20offset='0.9'%20stop-color='%2370C9E4'/%3e%3c/linearGradient%3e%3clinearGradient%20id='paint1_linear_110_4764'%20x1='19.651'%20y1='5.88916'%20x2='19.651'%20y2='27.8676'%20gradientUnits='userSpaceOnUse'%3e%3cstop%20stop-color='%234D3DDD'/%3e%3cstop%20offset='0.322115'%20stop-color='%2364CDED'/%3e%3cstop%20offset='0.5'%20stop-color='%23736CFF'/%3e%3cstop%20offset='0.75'%20stop-color='%2364CDED'/%3e%3cstop%20offset='1'%20stop-color='%234D3DDD'/%3e%3c/linearGradient%3e%3c/defs%3e%3c/svg%3e)


'%20stroke='url(%23paint1_linear_110_4820)'%20stroke-width='0.5'/%3e%3cdefs%3e%3clinearGradient%20id='paint0_linear_110_4820'%20x1='20.0002'%20y1='4.11661'%20x2='20.0002'%20y2='33.8832'%20gradientUnits='userSpaceOnUse'%3e%3cstop%20offset='0.1'%20stop-color='%235549C2'/%3e%3cstop%20offset='0.9'%20stop-color='%2370C9E4'/%3e%3c/linearGradient%3e%3clinearGradient%20id='paint1_linear_110_4820'%20x1='20.0002'%20y1='4.11661'%20x2='20.0002'%20y2='33.8832'%20gradientUnits='userSpaceOnUse'%3e%3cstop%20stop-color='%234D3DDD'/%3e%3cstop%20offset='0.322115'%20stop-color='%2364CDED'/%3e%3cstop%20offset='0.5'%20stop-color='%23736CFF'/%3e%3cstop%20offset='0.75'%20stop-color='%2364CDED'/%3e%3cstop%20offset='1'%20stop-color='%234D3DDD'/%3e%3c/linearGradient%3e%3c/defs%3e%3c/svg%3e)

'%3e%3cpath%20d='M12.9414%2023.0626C12.6251%2023.0626%2012.3687%2023.319%2012.3687%2023.6354L12.3687%2025.1077C12.3687%2025.424%2012.6251%2025.6805%2012.9414%2025.6805H12.9868C14.4524%2025.6805%2016.6386%2025.6805%2018.1041%2025.6805H18.1622C18.4785%2025.6805%2018.735%2025.424%2018.735%2025.1077L18.735%2023.6354C18.735%2023.319%2018.4785%2023.0626%2018.1622%2023.0626H12.9414Z'%20fill='%23899FCF'/%3e%3cpath%20d='M18.7514%2020.8724C18.7514%2020.0855%2019.1849%2019.3779%2019.764%2018.8452C21.016%2017.6937%2021.8005%2016.0418%2021.8005%2014.2067C21.8005%2010.727%2018.9796%207.90607%2015.4999%207.90607C12.0202%207.90607%209.19928%2010.727%209.19928%2014.2067C9.19928%2016.0435%209.9853%2017.6968%2011.2393%2018.8484C11.8181%2019.3799%2012.2511%2020.0866%2012.2511%2020.8724C12.2511%2021.1887%2012.5076%2021.4452%2012.8239%2021.4452H18.1786C18.495%2021.4452%2018.7514%2021.1887%2018.7514%2020.8724Z'%20fill='%23899FCF'/%3e%3c/g%3e%3cdefs%3e%3cclipPath%20id='clip0_111_18741'%3e%3crect%20width='19'%20height='19'%20fill='white'%20transform='translate(6%207.29321)'/%3e%3c/clipPath%3e%3c/defs%3e%3c/svg%3e)

'%3e%3cpath%20fill-rule='evenodd'%20clip-rule='evenodd'%20d='M24.0701%207.72604L20.7065%207.72604C20.3309%207.72604%2020.0265%208.03047%2020.0265%208.40599L20.0265%2011.7696C20.0265%2011.9911%2020.1324%2012.1879%2020.2964%2012.312L18.6479%2015.609L17.4892%2015.609L17.4944%2015.6038C16.454%2015.6038%2016.3965%2014.6207%2016.3934%2014.5122L16.3934%2012.3475C16.3934%2011.972%2016.089%2011.6676%2015.7134%2011.6676L12.3498%2011.6676C11.9743%2011.6676%2011.6699%2011.972%2011.6699%2012.3475L11.6699%2015.7111C11.6699%2015.748%2011.6728%2015.7842%2011.6785%2015.8195L9.81296%2019.5505L7.92995%2019.5505C7.55442%2019.5505%207.25%2019.8549%207.25%2020.2305L7.25%2023.594C7.25%2023.9696%207.55442%2024.274%207.92995%2024.274L11.2935%2024.274C11.6691%2024.274%2011.9735%2023.9696%2011.9735%2023.594L11.9735%2020.2305C11.9735%2020.0089%2011.8675%2019.8121%2011.7035%2019.688L13.352%2016.3911L14.6282%2016.3911C15.5514%2016.4636%2015.6058%2017.3707%2015.609%2017.4775L15.609%2019.6526C15.609%2020.0281%2015.9135%2020.3325%2016.289%2020.3325L19.6526%2020.3325C20.0281%2020.3325%2020.3325%2020.0281%2020.3325%2019.6526L20.3325%2016.289C20.3325%2016.2508%2020.3294%2016.2133%2020.3233%2016.1768L22.187%2012.4495L24.0701%2012.4495C24.4456%2012.4495%2024.75%2012.1451%2024.75%2011.7696L24.75%208.40599C24.75%208.03047%2024.4456%207.72604%2024.0701%207.72604Z'%20fill='%23899FCF'/%3e%3c/g%3e%3cdefs%3e%3cclipPath%20id='clip0_2772_12454'%3e%3crect%20width='20'%20height='20'%20fill='white'%20transform='translate(6%206)'/%3e%3c/clipPath%3e%3c/defs%3e%3c/svg%3e)


'%3e%3cpath%20d='M14.5615%2031.9046H25.9297C26.5036%2031.9046%2026.9697%2032.3701%2026.9697%2032.9437V35.7552L26.9639%2035.8616C26.9104%2036.3852%2026.4676%2036.7933%2025.9297%2036.7933H25.8037C25.1902%2036.7934%2024.6569%2037.0835%2024.1855%2037.4368C23.9487%2037.6144%2023.7206%2037.8125%2023.5029%2038.0062C23.2832%2038.2016%2023.0755%2038.3909%2022.8682%2038.5589C22.5182%2038.8424%2022.0724%2039.012%2021.5869%2039.012H18.8779C18.3922%2039.012%2017.9456%2038.8424%2017.5957%2038.5589C17.3883%2038.3909%2017.1806%2038.2016%2016.9609%2038.0062C16.7434%2037.8126%2016.516%2037.6143%2016.2793%2037.4368C15.8668%2037.1275%2015.4065%2036.8672%2014.8867%2036.8069L14.6611%2036.7933H14.5615C13.9879%2036.7931%2013.5235%2036.3288%2013.5234%2035.7552V32.9437C13.5235%2032.3701%2013.9878%2031.9047%2014.5615%2031.9046ZM20.3848%200.98761C27.847%200.98761%2033.8963%207.03716%2033.8965%2014.4993C33.8965%2018.4346%2032.2143%2021.9769%2029.5293%2024.4466C28.2431%2025.6297%2027.258%2027.2224%2027.2578%2029.014V29.015C27.2575%2029.5885%2026.7914%2030.054%2026.2178%2030.054H14.5586C13.985%2030.054%2013.5188%2029.5885%2013.5186%2029.015V29.014C13.5183%2027.2247%2012.5334%2025.6349%2011.248%2024.4544C8.55856%2021.9844%206.87305%2018.4383%206.87305%2014.4993C6.8732%207.03726%2012.9227%200.987767%2020.3848%200.98761ZM20.0518%2018.6585C19.6614%2018.6587%2019.3447%2018.976%2019.3447%2019.3665V26.6859C19.345%2027.0761%2019.6615%2027.3927%2020.0518%2027.3929H20.7178C21.1082%2027.3929%2021.4245%2027.0762%2021.4248%2026.6859V19.3665C21.4248%2018.9759%2021.1084%2018.6585%2020.7178%2018.6585H20.0518Z'%20fill='url(%23paint0_linear_166_518)'%20stroke='url(%23paint1_linear_166_518)'%20stroke-width='0.416667'/%3e%3c/g%3e%3cdefs%3e%3clinearGradient%20id='paint0_linear_166_518'%20x1='20.3849'%20y1='0.779602'%20x2='20.3849'%20y2='39.2204'%20gradientUnits='userSpaceOnUse'%3e%3cstop%20offset='0.1'%20stop-color='%235549C2'/%3e%3cstop%20offset='0.9'%20stop-color='%2370C9E4'/%3e%3c/linearGradient%3e%3clinearGradient%20id='paint1_linear_166_518'%20x1='20.3849'%20y1='0.779602'%20x2='20.3849'%20y2='39.2204'%20gradientUnits='userSpaceOnUse'%3e%3cstop%20stop-color='%234D3DDD'/%3e%3cstop%20offset='0.322115'%20stop-color='%2364CDED'/%3e%3cstop%20offset='0.5'%20stop-color='%23736CFF'/%3e%3cstop%20offset='0.75'%20stop-color='%2364CDED'/%3e%3cstop%20offset='1'%20stop-color='%234D3DDD'/%3e%3c/linearGradient%3e%3cclipPath%20id='clip0_166_518'%3e%3crect%20width='40'%20height='40'%20fill='white'/%3e%3c/clipPath%3e%3c/defs%3e%3c/svg%3e)


'%3e%3cpath%20d='M31.01%204.32568C29.1716%207.09907%2027.894%209.22748%2027.1194%2010.8218C26.607%2011.8752%2026.3824%2012.5664%2026.2971%2013.019C26.2127%2013.467%2026.2606%2013.7057%2026.3293%2013.8325V13.8335L26.3323%2013.8384C26.3498%2013.8686%2026.3918%2013.9371%2026.4934%2013.9897C26.5848%2014.0371%2026.7072%2014.0629%2026.8733%2014.063C27.2288%2014.063%2027.6883%2013.9506%2028.2385%2013.7456C28.7927%2013.5391%2029.4565%2013.2322%2030.2258%2012.8267C31.7308%2012.0333%2033.655%2010.8562%2035.9875%209.3042L36.3762%209.79346C34.0139%2012.0094%2032.1768%2013.8719%2030.9241%2015.5464C29.6466%2017.2539%2028.9592%2018.7892%2028.9592%2020.3247V20.5327H28.9709C29.0302%2021.999%2029.7102%2023.4718%2030.9299%2025.1021C32.1828%2026.7767%2034.0204%2028.6388%2036.3831%2030.855L35.9924%2031.3442C33.66%2029.7923%2031.7356%2028.6151%2030.2307%2027.8218C29.4616%2027.4163%2028.7984%2027.1093%2028.2444%2026.9028C27.6942%2026.6978%2027.2346%2026.5854%2026.8792%2026.5854C26.7132%2026.5855%2026.5907%2026.6114%2026.4993%2026.6587C26.3975%2026.7114%2026.3556%2026.7809%2026.3381%2026.811L26.3352%2026.8149C26.2662%2026.9414%2026.2184%2027.179%2026.303%2027.6274C26.3883%2028.0793%2026.6129%2028.7705%2027.1252%2029.8267C27.8998%2031.4207%2029.1724%2033.5483%2031.0159%2036.3218L30.5256%2036.7114C28.3119%2034.3499%2026.4515%2032.5118%2024.7776%2031.2583C23.0705%2029.98%2021.5349%2029.2915%2019.9983%2029.2915C18.4617%2029.2915%2016.9261%2029.98%2015.219%2031.2583C13.545%2032.5119%2011.6839%2034.3496%209.46997%2036.7114L8.97974%2036.3218C10.818%2033.5485%2012.0967%2031.4209%2012.8713%2029.8267C13.3835%2028.7736%2013.6082%2028.083%2013.6936%2027.6304C13.7782%2027.1812%2013.7304%2026.9415%2013.6614%2026.8149L13.6584%2026.811L13.6096%2026.7437C13.5843%2026.716%2013.5483%2026.6851%2013.4973%2026.6587C13.4059%2026.6114%2013.2834%2026.5855%2013.1174%2026.5854C12.7619%2026.5854%2012.303%2026.6978%2011.7532%2026.9028C11.1995%2027.1093%2010.5367%2027.4163%209.76782%2027.8218C8.26358%2028.6151%206.33836%2029.7912%204.00317%2031.3433L3.61841%2030.855C5.98121%2028.6386%207.81958%2026.7767%209.07251%2025.1021C10.3498%2023.3947%2011.0372%2021.86%2011.0374%2020.3247C11.0374%2018.7892%2010.35%2017.2539%209.07251%2015.5464C7.81948%2013.8716%205.9815%2012.0091%203.61841%209.79248L4.00317%209.3042C6.33861%2010.8564%208.26347%2012.0333%209.76782%2012.8267C10.5367%2013.2322%2011.1995%2013.5391%2011.7532%2013.7456C12.303%2013.9506%2012.7619%2014.063%2013.1174%2014.063C13.2835%2014.063%2013.4059%2014.037%2013.4973%2013.9897C13.5988%2013.9372%2013.6409%2013.8687%2013.6584%2013.8384L13.6614%2013.8335C13.7304%2013.707%2013.7783%2013.4696%2013.6936%2013.021C13.6083%2012.5691%2013.3837%2011.8779%2012.8713%2010.8218H12.8704C12.0956%209.22166%2010.8232%207.09888%208.97974%204.32568L9.46997%203.93701C11.6838%206.29874%2013.5434%208.13651%2015.2161%209.39014C16.9217%2010.6684%2018.4559%2011.3578%2019.9924%2011.3579C21.529%2011.3579%2023.0646%2010.6685%2024.7717%209.39014C26.4457%208.13661%2028.3061%206.29858%2030.5198%203.93701L31.01%204.32568Z'%20fill='url(%23paint0_linear_166_603)'%20stroke='url(%23paint1_linear_166_603)'%20stroke-width='0.416667'/%3e%3c/g%3e%3cdefs%3e%3clinearGradient%20id='paint0_linear_166_603'%20x1='20.001'%20y1='3.65479'%20x2='20.001'%20y2='36.9939'%20gradientUnits='userSpaceOnUse'%3e%3cstop%20offset='0.1'%20stop-color='%235549C2'/%3e%3cstop%20offset='0.9'%20stop-color='%2370C9E4'/%3e%3c/linearGradient%3e%3clinearGradient%20id='paint1_linear_166_603'%20x1='20.001'%20y1='3.65479'%20x2='20.001'%20y2='36.9939'%20gradientUnits='userSpaceOnUse'%3e%3cstop%20stop-color='%234D3DDD'/%3e%3cstop%20offset='0.322115'%20stop-color='%2364CDED'/%3e%3cstop%20offset='0.5'%20stop-color='%23736CFF'/%3e%3cstop%20offset='0.75'%20stop-color='%2364CDED'/%3e%3cstop%20offset='1'%20stop-color='%234D3DDD'/%3e%3c/linearGradient%3e%3cclipPath%20id='clip0_166_603'%3e%3crect%20width='33.3333'%20height='33.3333'%20fill='white'%20transform='translate(3.33167%203.65479)'/%3e%3c/clipPath%3e%3c/defs%3e%3c/svg%3e)




'%20fill='white'/%3e%3cpath%20d='M7.19995%2021.6808C7.19995%2020.3553%208.27447%2019.2808%209.59995%2019.2808H38.3999C39.7254%2019.2808%2040.7999%2020.3553%2040.7999%2021.6808V36.0808C40.7999%2037.4062%2039.7254%2038.4808%2038.4%2038.4808H9.59995C8.27447%2038.4808%207.19995%2037.4062%207.19995%2036.0808V21.6808Z'%20fill='%230A328F'/%3e%3cpath%20d='M22.4787%2029.5558L12.0292%2023.407C11.4796%2023.0835%2011.1421%2022.4934%2011.1421%2021.8556V13.8165C11.1421%2012.491%2012.2166%2011.4165%2013.5421%2011.4165H34.4584C35.7838%2011.4165%2036.8584%2012.491%2036.8584%2013.8165V21.8556C36.8584%2022.4934%2036.5209%2023.0835%2035.9712%2023.407L25.5216%2029.5558C24.5826%2030.1084%2023.4178%2030.1084%2022.4787%2029.5558Z'%20fill='%2340D1F1'/%3e%3cpath%20d='M16.8351%2016.5635L31.1649%2016.5635'%20stroke='%230A328F'%20stroke-width='2.4'%20stroke-linecap='round'%20stroke-linejoin='round'/%3e%3cpath%20d='M16.8351%2021.2124L24%2021.1465'%20stroke='%230A328F'%20stroke-width='2.4'%20stroke-linecap='round'%20stroke-linejoin='round'/%3e%3c/svg%3e)

