Read or buy our new book, Build: Elements of an Effective Software Organization →

Learn what “good” looks like with Swarmia’s engineering benchmarks

Your best benchmark is your own baseline. But if you’re interested in quickly identifying opportunities for improvement, start here.

Drive engineering effectiveness with sensible benchmarks

Use benchmarks from modern engineering organizations to understand where your organization stands compared to peers.
Learn how to use these benchmarks
Change target:
Great
Great
Good
Needs attention
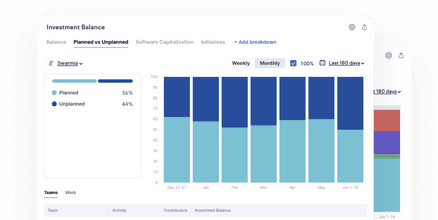
Engineering investment
A sustainable engineering organization requires investment in non-product work.
The distribution of engineering work, according to the Balance Framework
10% KTLO,
15% productivity,
60% on new things &
improving things
30% KTLO,
10% productivity
50% KTLO,
or < 10% productivity
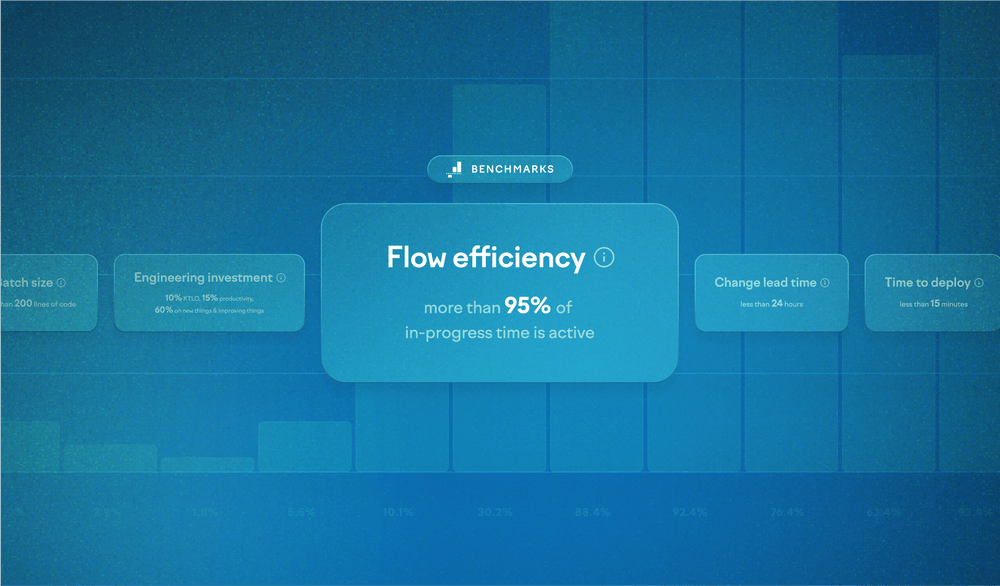
Flow efficiency
Idle work suggests frequent interruptions and priority changes.
The share of days an issue was actively worked on during its lifetime.
> 95% of in-progress
time is active
> 70% of in-progress
time is active
< 70% of in-progress
time is active
Batch size
Smaller batches of work tend to move through the system faster and have less risk.
The number of lines in most changes.
< 200 lines
< 500 lines
> 500 lines
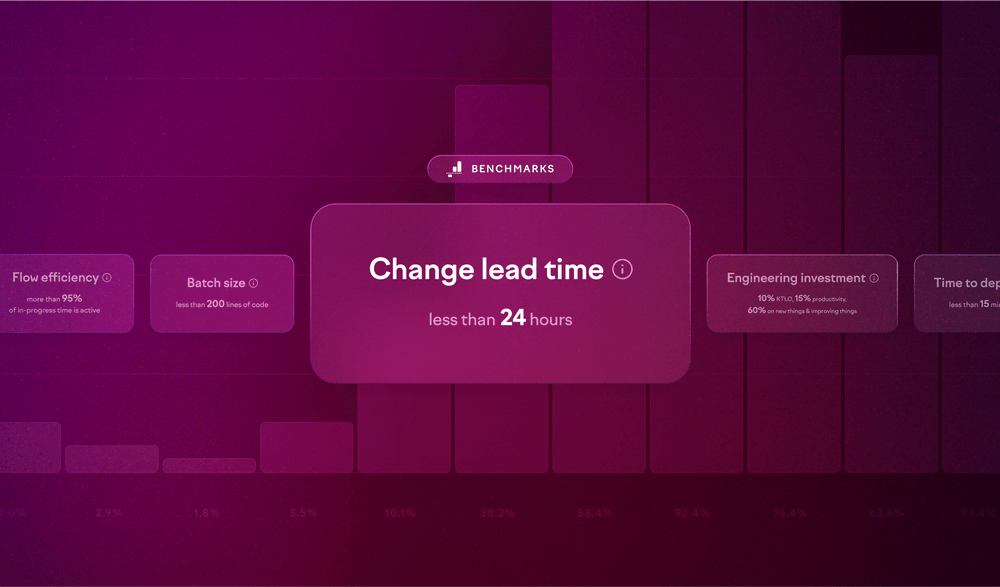
Lead time to change
Long lead times might be a symptom of overly large increments, frequent interruptions, or too much WIP.
How long it takes for a task to go from start to production. This includes:
< 24 hours
< 3 working days
> 7 working days
PR cycle time
Speeding up code reviews is often the most effective way to improve cycle time.
How long it takes for an open PR to be merged. This includes:

Coding time
Review time
Merge time
< 24 hours
< 3 working days
> 5 working days
Deployment frequency
Frequent deploys encourage smaller changes and enable rapid iteration.
How often new code gets released to users.
Continuously
Daily
Less than daily
Time to deploy
Rapid deploys enable quicker incident mitigation and encourage smaller changes.
How long it takes for most approved changes to reach production.
< 15 minutes
< 30 minutes
> 1 hour
Find your engineering organization’s biggest opportunities for improvement.

Start your continuous improvement journey today

Understand your baseline, recognize concrete areas of improvement, and start systematically driving engineering effectiveness.
Watch our product tour
Establish your baseline
Focus your efforts on areas where you have the most room for improvement.
Eliminate teamwork anti-patterns
Identify and fix harmful behaviors like siloing or too much work in progress.
Put improvement on autopilot
Adopt relevant and achievable working agreements as a team.
Swarmia instantly gave us a baseline, and we could see historical information on where we were in terms of key metrics.
Tim Nott
CTO, FactoryFix
Get your baseline metrics by connecting to Swarmia.
More from the swarmia blog

Sensible benchmarks for evaluating the effectiveness of your engineering organization

Read now

Measuring software development productivity

Read now

Identify and eliminate common productivity bottlenecks for engineering teams

Read now