Read or buy our new book, Build: Elements of an Effective Software Organization →

Put your DORA metrics to work with Swarmia

Most tools that measure DORA metrics are nothing but static dashboards. Swarmia not only tracks your DORA metrics but also helps you make long-lasting improvements based on them.

Trusted by effective engineering organizations

Improve your DORA metrics with Swarmia

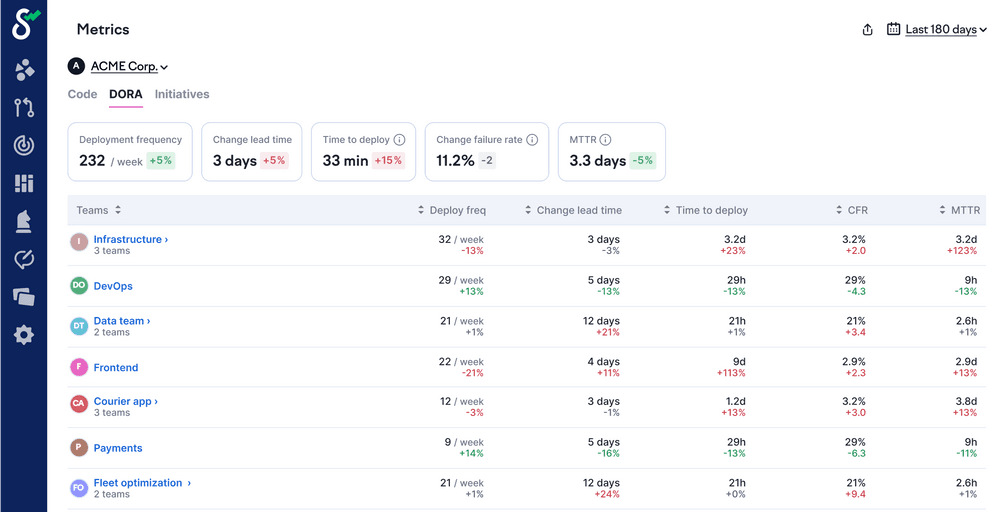
The four DORA metrics measure software delivery performance and were popularized by the annual State of DevOps reports and the 2018 book Accelerate. Here's how to measure each of them with Swarmia.

Deployment frequency

Deployment frequency measures how often your organization successfully releases code to production.

Swarmia gives you visibility into deployment frequency and batch size (i.e. the lines of code changed per pull request). This way, your whole team gets a clear understanding of the relationship between pull request size and the frequency of deployments, allowing you to optimize your processes and workflows.

Deployment frequency

Lead time for changes

Lead time for changes reflects the amount of time it takes for a commit to get into production.

The Pull Requests view in Swarmia allows you to keep track of the four stages of your team's PR cycle time: in progress, review, merge, and release. You can also set team-wide working agreements to make sure that no PRs stay open longer than X days or that reviews happen within X hours.

Lead time for changes

Change failure rate

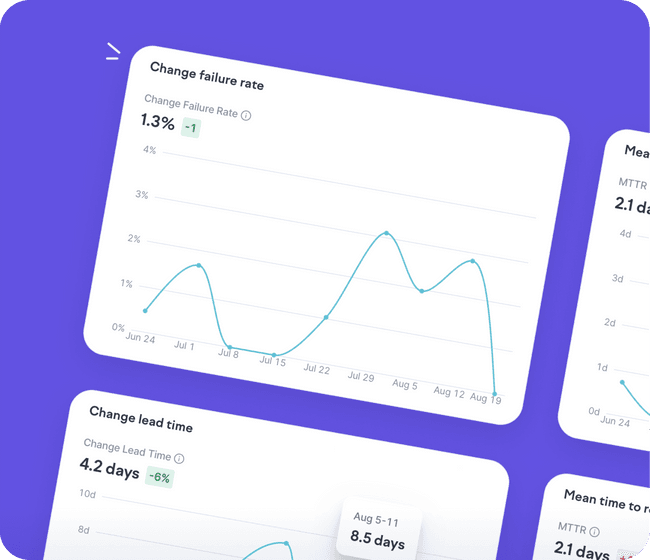
Change failure rate measures the percentage of deployments that cause a failure in production.

While most tools only measure deployment success/failure rate, Swarmia also surfaces the share of successful deployments that have defects. It also links the deployment with a defect to the deployment that fixes the defect, making sure that you get a full picture of what went wrong and what was included in the fix.

Change failure rate

Time to recovery

Time to recovery (TTR) or mean time to recovery (MTTR) reflects how long it takes your organization to recover from a failure in production.

In Swarmia, time to recovery is the time difference between the change failure and the deployment that recovered the issue. This data allows you to understand the mean time it takes your team to fix issues in production and have better incident post mortems.

Time to recovery
With Swarmia, we’ve been able to highlight problem areas, set target levels, and drive continuous improvement. In two months, we’ve decreased our teams' cycle time by 40%.
Alex Plugaru
Co-Founder & CTO at Gorgias

Go beyond DORA metrics

DORA metrics are a great place to start when you're looking to accelerate software delivery performance. But they're only one part of the puzzle in building high-performing engineering teams.

Swarmia helps you surface a wide variety of engineering productivity insights and gives you the tools you need to drive continuous improvements.

Learn more about the engineering metrics in Swarmia →

The best teams get better all the time. Join the 1,000+ teams using Swarmia today.

Learn more from our blog

Practical guide to DORA metrics

Read now

DORA change failure rate – what, why, and how

Read now

Measuring software development productivity

Read now