Practical guide to DORA metrics

Ever since the book Accelerate was published in 2018, it’s been borderline impossible to have a conversation about measuring software development performance without any reference to the four DORA metrics that were popularized by the book.
And while DORA metrics are a useful tool for understanding your software delivery performance, there are a number of things you should consider before you jump head-first into measuring them. In this post, we discuss how the four DORA metrics came to be, what they are, how to get started with measuring them, and how to avoid some of the typical mistakes software teams make when they’re first starting out with DORA metrics.
What is DORA?
The DevOps Research and Assessment (DORA) team was founded in 2014 as an independent research group focused on investigating the practices and capabilities that drive high performance in software delivery and financial results. The DORA team is known for the annual State of DevOps report that has been published for seven consecutive years, from 2014 to 2021. In 2019, DORA was acquired by Google.
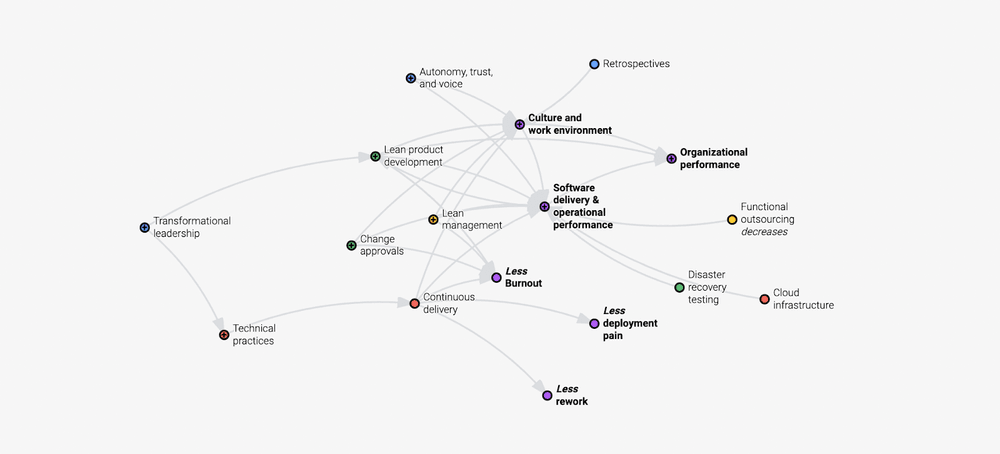
In 2018, three members of the DORA team, Nicole Forsgren, Jez Humble, and Gene Kim, published a book called Accelerate: The Science of Lean Software and DevOps: Building and Scaling High Performing Technology Organizations, which goes into more detail about the group’s research methodology and findings. In short, the book uncovers a complex relationship between organizational culture, operational performance, and organizational performance.

Accelerate is a must-read for anyone interested in building a high-performing software organization — as well as anyone planning to implement DORA metrics.
What are the four DORA engineering metrics?
Even though the State of DevOps reports and Accelerate uncover complex relationships between culture, software delivery, and organizational performance, the most famous part of the group’s research are the four software delivery performance metrics that have come to be known as DORA metrics.
The four DORA metrics are:
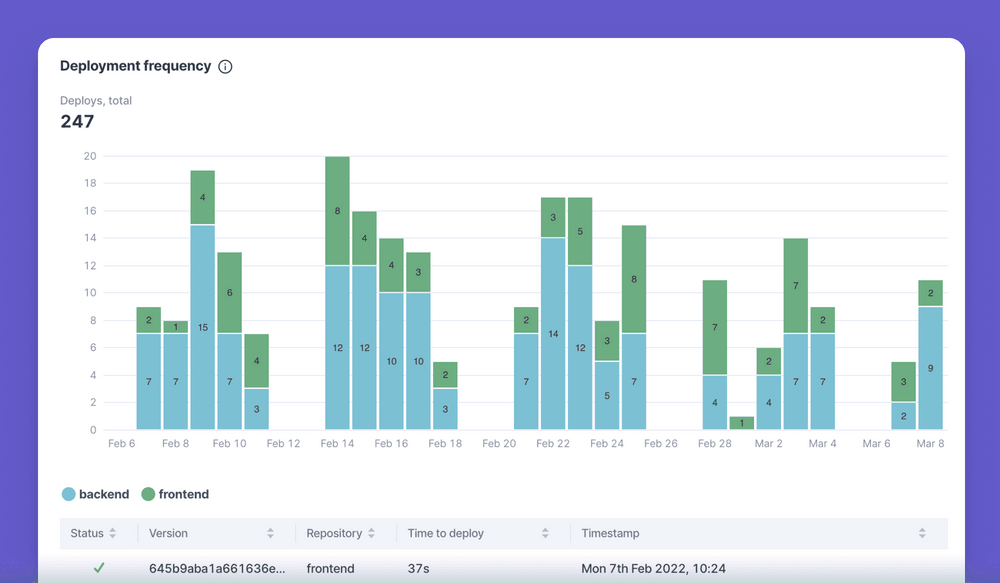
- Deployment frequency: How often a software team pushes changes to production
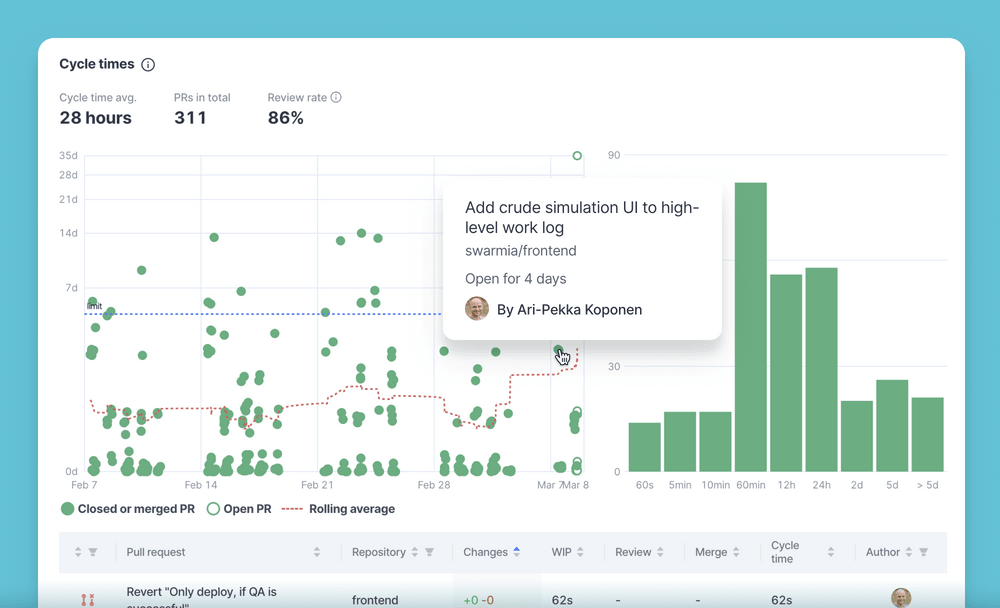
- Change lead time: The time it takes to get committed code to run in production
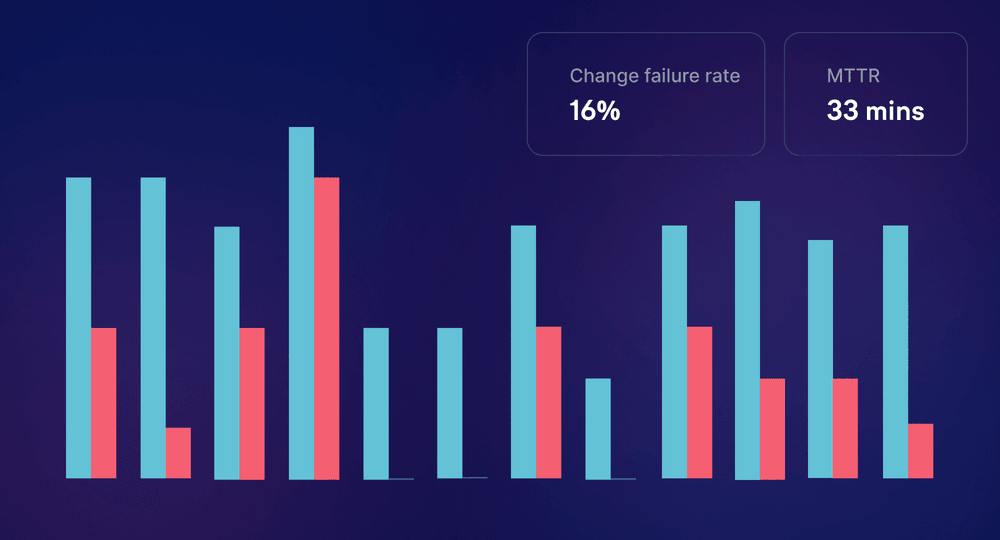
- Change failure rate: The share of incidents, rollbacks, and failures out of all deployments
- Time to restore service: The time it takes to restore service in production after an incident
The unique aspect of the research is that these metrics were shown to predict an organization's ability to deliver good business outcomes. This predictive capability makes DORA metrics not only essential for engineering teams but also valuable for investors evaluating a company's operational efficiency.
Why should I care about DORA metrics?
Historically, measuring software development productivity was mostly a matter of opinion. But since your opinion is as good as mine, any discussion stalled easily and most organizations defaulted to doing nothing.
The team behind DORA applied scientific rigor to evaluating how some well-known DevOps best practices relate to business outcomes.
The four metrics represent a simple and relatively harmless way start your journey. The basic logic is: maximize your ability to iterate quickly while making sure that you're not sacrificing quality.
In this space, being mostly harmless is already an achievement. The industry is full of attempts to stack-rank your developers based on the number of commits or provide coaching based on the number of times they edited their own code.
The four metrics
Next up, let’s look at each of the metrics in turn.
Deployment frequency
Deployment frequency measures how often a team pushes changes to production. High-performing software teams ship often and in small increments.
Shipping often and in small batches is beneficial for two reasons. First, it helps software teams create customer value faster. Second, it reduces risk by making it easier to identify and fix any possible issues in production.
As an aside, before I continue: for some teams, like mobile app development teams, tracking DORA metrics doesn't really make sense.
Deployment frequency is affected by a number of things:
- Can we trust our automated tests? A passing test suite should indicate that it's safe to deploy to production, and a failing test suite should indicate that we need to fix something. Problems arise from a lack of automated test coverage and flaky tests.
- Are the deployments automated? Investing in automated deployments pays itself back very quickly.
- Is it possible to ship in small increments? Optimally, your developers will work in short-lived branches. Features under construction will be hidden from end-users with feature gates.
- Do we know how to split work to small increments? Planning and splitting the work requires some practice and a good grasp of the codebase.

The best teams deploy to production after every change, multiple times a day. If deploying feels painful or stressful, you need to do it more frequently.
Change lead time
Change lead time (also known as lead time for change or cycle time) captures the time it takes to get committed code to run in production.
The purpose of the metric is to highlight the waiting time in your development process. Your code needs to wait for someone to review it and it needs to get deployed. Sometimes it's delayed further by a manual quality assurance process or an unreliable CI/CD pipeline.
These extra steps in your development process exist for a reason, but the ability to iterate quickly makes everything else run more smoothly. It might be worth taking some extra risk for the added agility, and in many cases, smaller batch size actually reduces risk.
The State of DevOps report suggests that on average, elite teams get changes to production in under a few hours. However, because the report is based on a survey, we're confident the reference value is more indicative of a happy path than an average. Anything in the ballpark of 24 hours is a great result.
For a team that's interested in improving their lead time for change, these are some common discussion topics:
- Is something in our process inherently slowing you down? If you're manually testing every change, requesting it from an external QA team is going to be slow. Can we embed testers into the team? Can we use feature flags to hide features while they're being worked on, so that most features can be tested as a whole?
- How quick are our code reviews? Pull request reviews don't have to be slow.
- Are you working on too many things at once? Multi-tasking might feel efficient when you're able to move from a blocked task to something else, but it also means that you're less likely to address those blockages.

Change failure rate
The first two metrics are mostly about your ability to iterate quickly. They're balanced by the next two metrics that ensure you're still running a healthy operation. The SPACE framework follows this same pattern of choosing metrics from different groups to balance each other. When you're choosing metrics that measure speed, also pick metrics to alert you when you're going too fast.
Change failure rate focuses on incidents caused by the changes that you've made yourself – as opposed to external factors, such as cloud provider downtime. This makes a great control variable for the first two metrics.
The definition of an incident or failure is up to you. Production downtime caused by a change is pretty clearly a failure. Having to roll back a change is likely a good indication too. Still, bugs are a normal byproduct of newly built software and you don't necessarily need to count every regression.
Good infrastructure will help you limit the blast radius of these issues. For example, our Kubernetes cluster only sends traffic to instances if they respond to readiness and liveness checks, blocking deployments that would otherwise take the whole app down.
Time to restore service
Mean Time To Restore (MTTR) captures the time it takes to restore service in production after an incident.
While the trends are useful to understand, the most important thing is that your organization has a solid process for incident response and allows the engineering teams to invest time in resolving the root causes of these incidents.
In a more complex microservices environment, you might also consider promoting Service Level Objectives instead of MTTR.
Common pitfalls with DORA metrics
The beauty of the four DORA metrics is that they offer a simple framework for measuring and benchmarking engineering performance across two variables: speed (deployment frequency and change lead time) and stability (change failure rate and time to restore service).
However, as anyone who’s ever worked in software engineering would attest: numbers — and especially aggregate ones — don’t always tell the whole truth. Here are some of the key issues we’ve seen with software organizations that are getting started with DORA metrics:
1. Taking them too literally
Cargo cults were common in early agile adoption. People would read a book about Scrum and argue about "the right way" to do things without understanding the underlying principles.
Speaking of books, Accelerate is a great one. And it actually does address the various factors that influence engineering performance, including organizational culture and developer well-being. However, when the whole book is reduced to the four DORA metrics, a bunch of this context is lost.
DevOps practices are not the only thing you need to care about. Great product management and product design practices still matter. Psychological safety still matters. Running a great product development organization takes more than just the four metrics.
2. Hiding behind aggregate metrics
Aggregate values of DORA metrics are useful for two main reasons: following the long-term trends and getting the initial benchmark for your organization.
However, your team needs more than the aggregate number to start driving improvement. What are the individual data points? What are the contributing factors for these numbers? How should they be integrated to your existing daily and weekly workflows?
3. Lack of organizational buy-in
Measuring software development productivity is a delicate topic, and as such, top-down decisions can easily cause some controversy. On the other hand, without direction from the engineering leadership, it's too easy to just give up.
The role of the leadership is to build an environment where teams and individuals can be successful. Ensuring that some feedback loops are in place is a perfect example of this. Thus, it makes sense to be proactive in this discussion.
Developers often have concerns about tracking harmful metrics and individual performance. I suggest proactively bringing it up and explaining how DORA metrics are philosophically aligned with how most developers think.
4. Obsessing over something that's good enough
If you're consistently getting code to production in 24 hours and you're deploying every change without major issues, you don't necessarily have to worry about DORA metrics too much. It's still good to keep these numbers around to make sure that you're not getting worse as complexity grows, but they don't need to be top of mind all the time.
The good news is that your continuous improvement journey doesn't need to stop there.
Moving beyond DORA metrics
The authors behind Accelerate have recently expanded their thinking on the topic of development productivity with the SPACE framework. It's a natural next step and if you haven't yet looked into it, now is a good time.
How to get started with measuring DORA metrics?
If you’re eager to start measuring the four DORA metrics, you can either spend some time on setting up a DIY solution or hit the ground running with a tool like Swarmia. Here’s a quick look at each of those approaches.
Setting up a DIY solution
The Four Keys is an open-source project that helps you automatically set up a data ingestion pipeline from your GitHub or Gitlab repositories to Google Data Studio through Google Cloud Services. It aggregates your data into a dashboard that tracks the four DORA metrics.
Here’s how to get started with the Four Keys.
Using an engineering productivity platform like Swarmia
For engineering leaders who are looking to not only measure the four DORA metrics but also improve across all areas of engineering productivity (including business impact and team health), a tool like Swarmia might be a better fit.

Subscribe to our newsletter
Get the latest product updates and #goodreads delivered to your inbox once a month.
More content from Swarmia


