The GitHub and Jira MCP servers are great until you ask them about the whole org
Otto Hilska, Founder & CEO · Nov 16, 2026
Many API calls from GitHub and Jira funneling into a single engineering report.
Connecting Claude Code to GitHub and Jira takes five minutes. The first answers are impressive: your open pull requests, the tickets in the current sprint, why last night’s build failed.
Then someone asks for cycle time by team for the last year. The same setup that answered the first questions in seconds now needs hundreds of thousands of API calls, nearly two days of rate-limit budget, and data that neither GitHub nor Jira has.
Next, we’ll talk about what the two servers do, how to set them up, and what that second question costs. We measured it on a public GitHub organization.
The tools are grouped into toolsets. The default set covers context, repositories, issues, pull requests, and users, and you add others, like Actions, explicitly. Adding /readonly to the URL drops every tool that writes, which is a sensible default if all you want is answers.
For Claude Code, GitHub’s install guide uses a personal access token with the remote server. Here’s its command (for Claude Code 2.1.1 and later), pointed at the read-only URL:
The tools that matter for reporting are list_pull_requests and search_pull_requests for finding pull requests, pull_request_read for the details of one pull request (with methods like get, get_reviews, and get_commits), list_commits, and the Actions tools for workflow runs. Lists return at most 100 items per page, and pull_request_read works on one pull request per call. That’s fine for one pull request.
What the Jira MCP server does
Atlassian’s official server is the Atlassian Rovo MCP server. It’s hosted by Atlassian at https://mcp.atlassian.com/v2/mcp, covers Jira, Confluence, Bitbucket, and other Atlassian apps, and uses OAuth 2.1 or API tokens. Admins decide which permission groups (read, search, write, and so on) the server may use.
In Claude Code:
claude mcp add--transport http atlassian https://mcp.atlassian.com/v2/mcp
Then run /mcp in a session to sign in.
The current version loads six Jira tools up front: getJiraIssue, searchJiraIssuesUsingJql, createJiraIssue, editJiraIssue, transitionJiraIssue, and addOrEditJiraIssueComment. The other 46 are discovered on demand, including tools for sprint data. Atlassian moved to this design because the previous version spent roughly 15,000 tokens on tool definitions before the user typed anything.
What they’re good at
Both servers are built for working on one thing at a time, on live data, with your permissions:
“Which pull requests are waiting for my review?”
“Why did the last build on this branch fail?”
“What’s still open in the current sprint, and what’s blocked?”
“Write a ticket for this bug and link it to the epic.”
“Summarize the discussion on PROJ-1234 before my 1:1.”
If your coding agent needs to read the ticket it’s working on, open a pull request, and move the ticket along, these are the servers to use. Nothing below changes that.
What happens when you ask about the whole organization
Reporting questions look the same as the ones above. “What’s our median cycle time by team for the last year?” is one sentence. To see what it takes to answer it from GitHub, we ran the numbers against Grafana’s public GitHub organization and its 523 public repositories.
The call count
Grafana merged 72,208 pull requests across its public repositories between November 2025 and November 2026. Cycle time needs at least three things per pull request: the pull request itself, its reviews (for time to first review), and its commits (for when the work started). That’s about three calls per pull request with pull_request_read. Our test run took 89 calls for 30 pull requests.
72,208 pull requests at three calls each is about 217,000 calls. A GitHub user token gets 5,000 REST requests an hour, so the backfill alone uses up 43 hours of rate limit. Apps owned by a GitHub Enterprise Cloud organization get 15,000 an hour, which brings it down to about 14 and a half.
That budget isn’t yours alone. Every tool acting as you draws from the same limit, so while the agent works through a year of history, your scripts and other integrations compete for what’s left. (We know this budget well. Swarmia’s own data collection works around it all day.)
Searching doesn’t get around this. GitHub’s search API returns at most 1,000 results per query and allows 30 searches a minute, so 72,000 pull requests means slicing the year into many small date ranges first. Search also returns pull requests, not their reviews or commits.
And this is only GitHub. Atlassian doesn’t publish rate limits for its MCP server, and users have hit 429 errors after about 20 parallel calls. Plain Jira lookups are free, but calls that return context enriched from Atlassian’s Teamwork Graph consume Rovo credits (as of November 2026).
The context window
Calls aren’t the only cost. Every tool result goes through the model’s context.
One call to list_pull_requests with the default settings returned 100 pull requests as about 425,000 characters of JSON: roughly 106,000 tokens for a single page. Asking only for the fields that cycle time needs (number, author, created, merged) brought the page down to about 6,000 tokens. The pull request, its reviews, and its commits added roughly 1,800 tokens per pull request on top.
For Grafana’s year, that’s about 135 million tokens before the agent computes anything. No context window holds that, and agents hit limits long before it. Claude Code, for example, won’t put an MCP result over 25,000 tokens into context by default. It saves the result to a file, and the agent has to go and read it.
The usual fix is to stop passing data through the model and have the agent write code instead. Anthropic described this pattern for MCP in general, and Armin Ronacher put it more bluntly: “Getting an LLM to calculate for you sort of works, but it’s much better for the LLM to write the Python code to do the calculation.” It works. It also means you now own a data pipeline: pagination, retries, rate-limit backoff, storage, and incremental updates so you don’t fetch the whole year again next week.
The tools change under you
These servers are young and change often. That’s mostly good news, since they keep getting better, but a reporting setup built on them inherits every change. In August 2026, a user reported that Jira’s searchJiraIssuesUsingJqlreturned at most five issues per call, whatever page size they asked for, and noted that it broke “every aggregate use case — velocity, throughput, cycle time, release scope, status reporting.” The reporter later said the cap appeared fixed, though the issue was still open when we checked. An agent that didn’t notice would have reported a very quiet quarter.
The harder problem: data that isn’t in either tool
Suppose you build the pipeline. Rate limits are an engineering problem, and engineers solve those. The bigger problem is that the answer depends on data neither GitHub nor Jira has.
Bots. In one page of 68 recently merged pull requests in the main Grafana repository, 15 were opened by bots, including cursor[bot]. Is a Dependabot bump part of your cycle time? Is a pull request opened by a coding agent? Someone has to decide, and the decision has to stay the same every time the report runs.
People and teams. One engineer can have a GitHub login, a Jira account, and a few email addresses. Teams change. “Cycle time by team” means the team each person was on when the work happened, not the team they’re on today, and neither API keeps that history.
Work and effort. Linking pull requests to issues, issues to epics, and epics to initiatives is what turns “we merged 6,000 pull requests” into “40% of our time went to the platform migration”. Neither tool knows how much effort went into an epic. That takes a model of who worked on what, and when.
Definitions. What counts as a deployment? A change failure? When does cycle time start: first commit, pull request opened, or issue moved to “In progress”? An agent will happily pick a definition. It may pick a different one next Friday.
Will Larson described what this looks like in practice in a July 2026 post: “I pulled data via an MCP, and the analysis was unintuitive to me.” The results in his incident tool “were only showing incidents that properly tagged a team when the alert was triggered, so it was omitting about half the relevant incidents.” He caught it because the answer felt wrong. Most numbers don’t feel wrong. They just are.
What an engineering-data MCP server changes
Swarmia already runs that pipeline and makes those decisions, continuously, for every organization it serves. The Swarmia MCP server lets the same agents query the results instead of the raw events.
We asked our own Swarmia organization the question from the start of this post: median cycle time for merged pull requests, by team, for the last year. It took one tool call. The answer covered every team in about 11,000 characters, under 3,000 tokens, with team membership, bots, and the cycle time definition already decided.
Bigger questions stay small, too. Here’s one from the Swarmia MCP page:
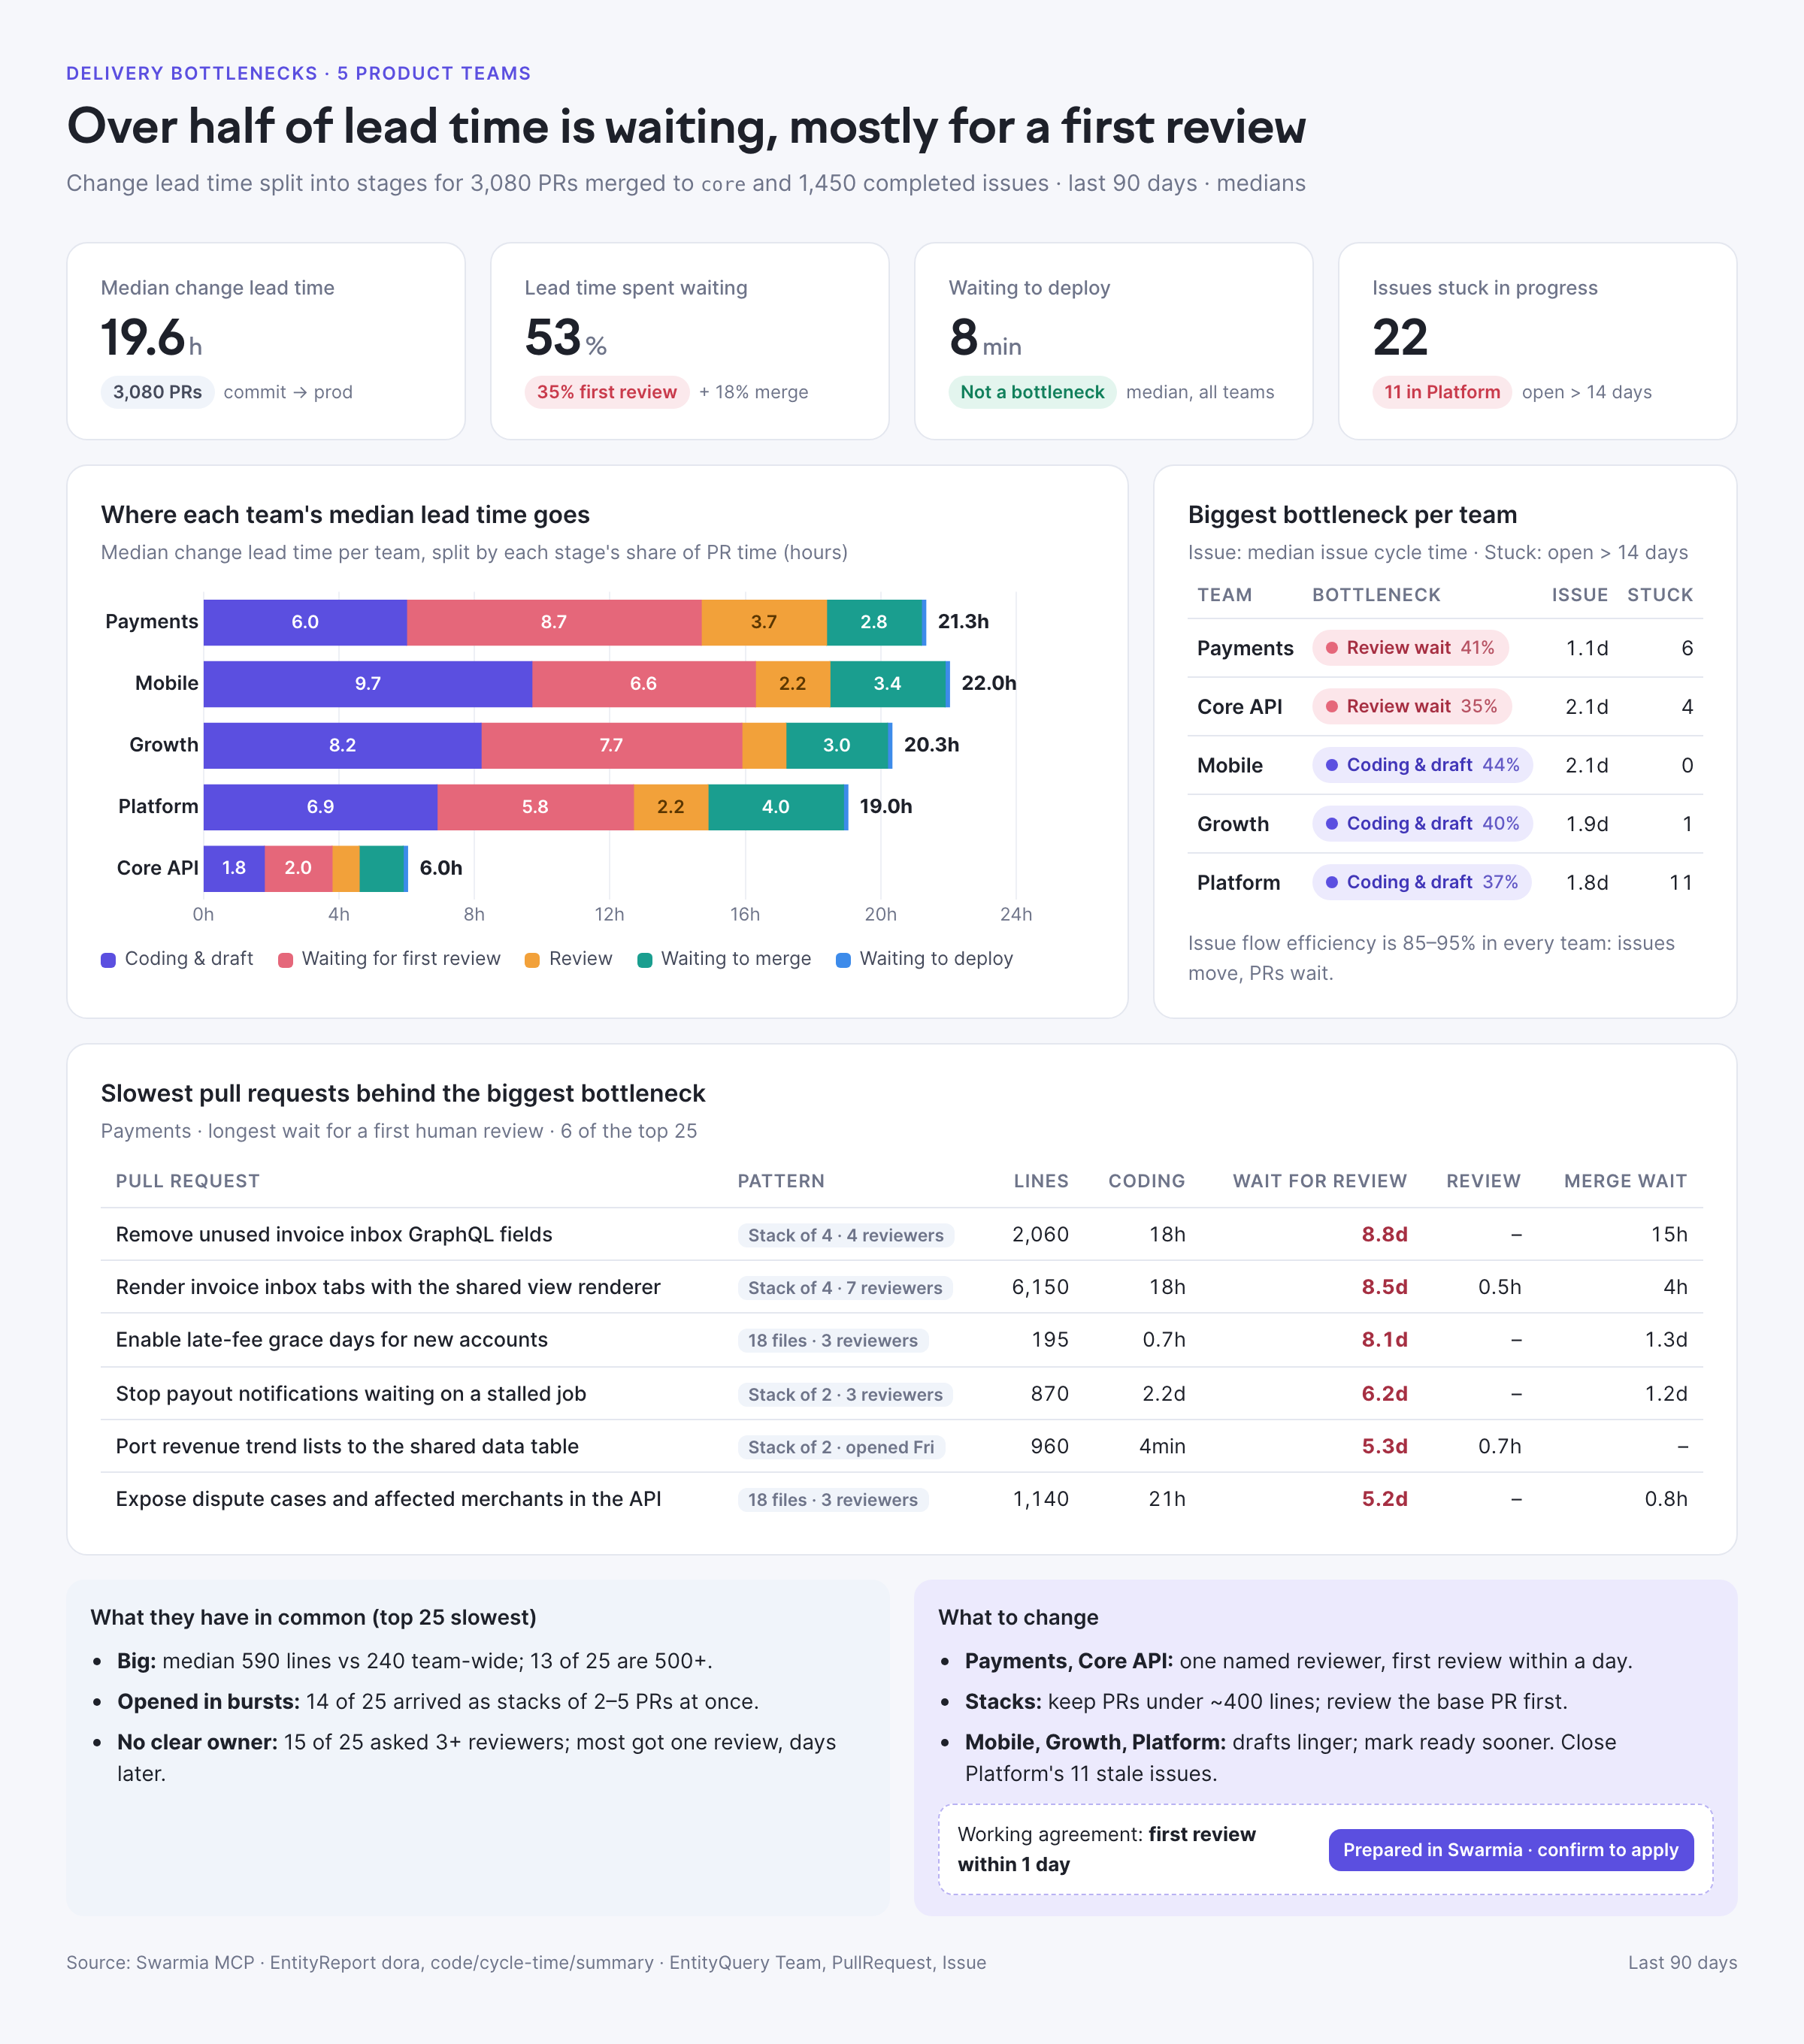
Where is delivery getting stuck in each team? For the last 90 days, break change lead time into stages and check issue cycle time, flow efficiency, and stuck issues. Then show me the slowest pull requests behind the biggest bottleneck and what they have in common.
The agent used four Swarmia tool calls, and the result looked like this (data anonymized):
Delivery bottlenecks by team from the Swarmia MCP server, with change lead time stages and the slowest pull requests
None of the work in the previous section went away. Someone still had to page through the APIs, handle rate limits, decide what counts as a deployment, and keep it all up to date. The difference is that it runs continuously in a system built for it, not in a context window every Monday.
Use both. The GitHub and Jira MCP servers are for doing the work, and Swarmia is for questions about the work. A coding agent can find the pull request behind a line of code with git, then ask Swarmia for the review discussion, the epic, and the team that owns it. A weekly report agent can pull metrics from Swarmia and open the follow-up tickets in Jira.
Start with the vendor servers
Connect the GitHub and Jira MCP servers to your agent today. They’re well built, and for anything that involves one repository, one sprint, or one ticket, they’re the right tool.
When someone asks for the same number next week, and the week after, don’t rebuild a data pipeline in a context window.
Bring your engineering data into your agent
See real prompts and what the Swarmia MCP server returns, from delivery bottlenecks to AI ROI, and how to connect it to Claude Code, Cursor, and other tools.
We ran these numbers on November 15, 2026, against public data only, and the Swarmia comparison against our own Swarmia organization. Rate limits and tool behavior are as documented at the time of writing.
Merged pull requests: GitHub’s search API, org:grafana is:pr is:merged merged:2025-11-15..2026-11-14, returned 72,208. The organization had 523 public repositories.
Calls per pull request: for 30 recently merged pull requests in grafana/grafana, we fetched the pull request, its reviews, and its commits through the REST API. That took 89 calls and 42 seconds. Pull requests with more than 100 reviews or commits would need extra pages.
Tool result sizes: we called GitHub’s hosted MCP server in read-only mode. list_pull_requests for 100 closed pull requests returned 424,789 characters by default and 24,685 characters with fields set to number, user, created_at, and merged_at. pull_request_read with get, get_reviews, and get_commits for one pull request returned 3,401, 3,049, and 901 characters. We converted characters to tokens at four characters per token, which is the same rough rule Atlassian uses.
Swarmia: one EntityQuery call for teams with the median cycle time and count of their merged pull requests for the last 365 days. The response was about 11,000 characters.
Bots: 15 of 68 merged pull requests in one page of grafana/grafana pull requests sorted by last update had a bot as the author.
Subscribe to our newsletter
Get the latest product updates and #goodreads delivered to your inbox once a month.