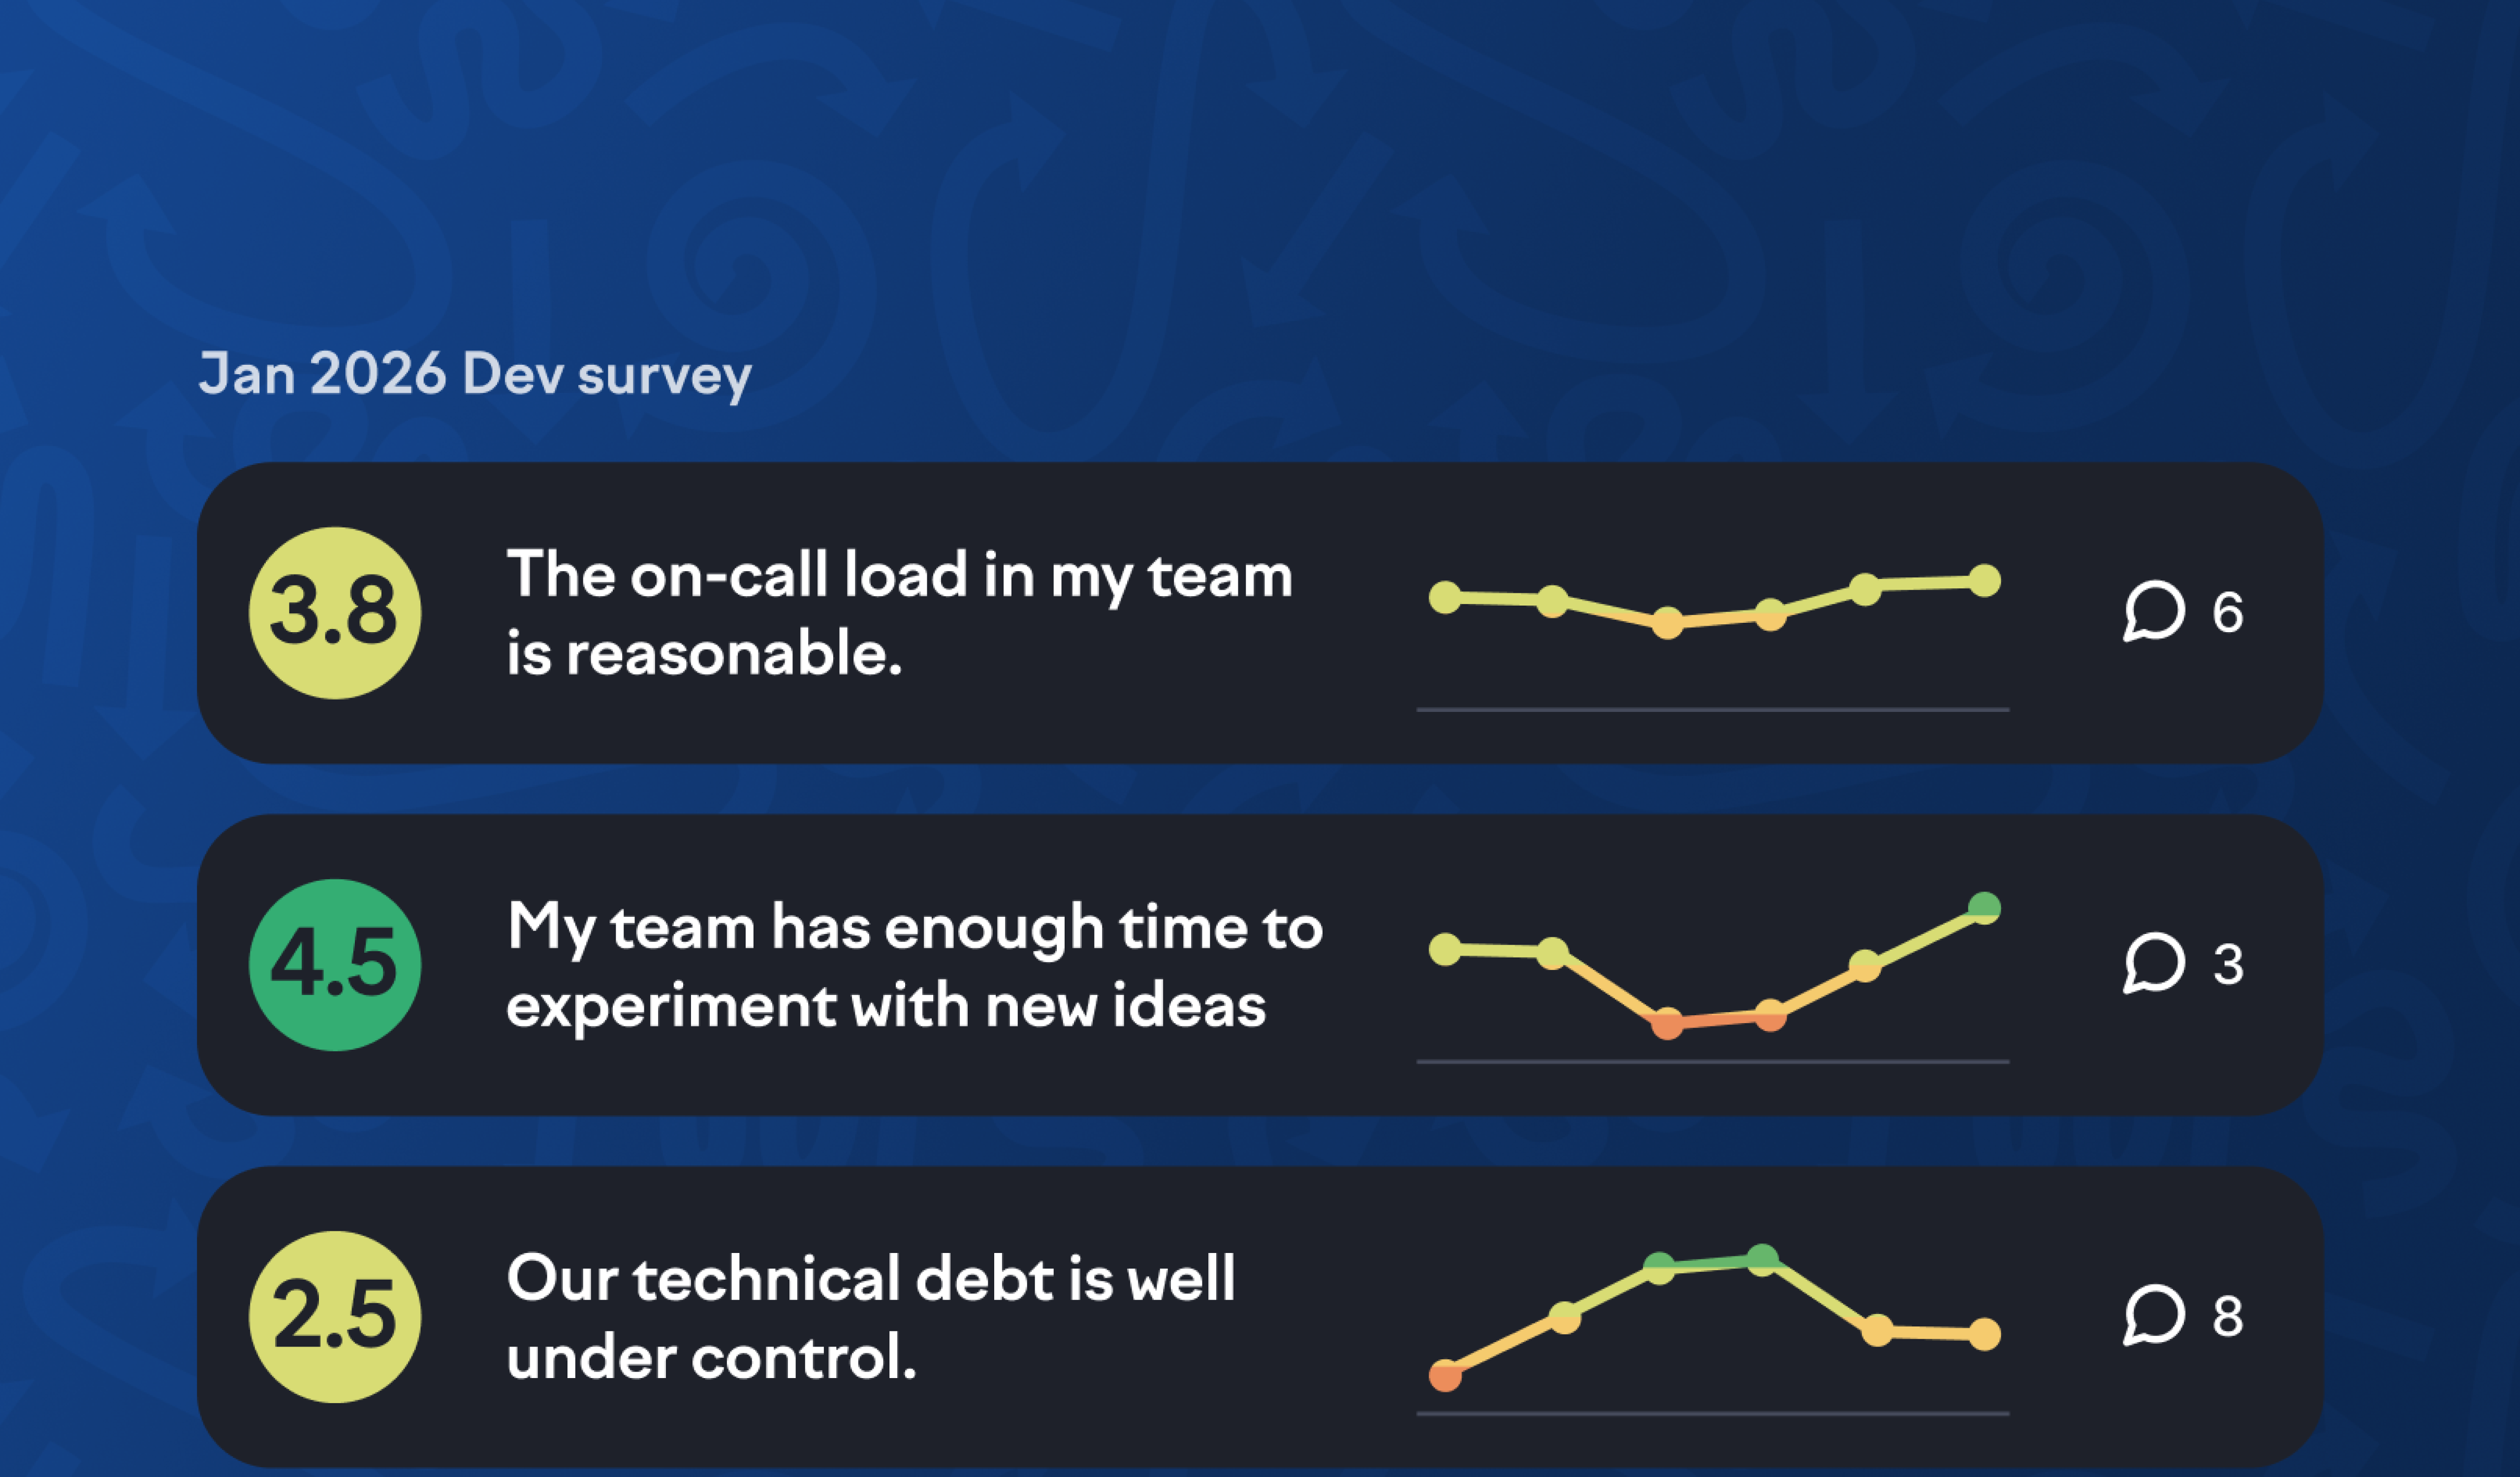
You can now see how survey scores have changed across multiple surveys with the new trend charts. Instead of comparing just two surveys at a time, you can now track progress over many surveys to understand whether things are moving in the right direction.
The trend charts appear in the questions & comments tab under surveys, and when viewing linked survey results for metrics throughout Swarmia. Hover over any data point to see the score from that survey.
The trend charts are useful for demonstrating that your improvement efforts are working. If you’ve been running recurring surveys and taking action on the feedback, you can now show the impact with clear trend data.
The feature is available for all Swarmia survey users.
More updates
You can now see flow efficiency in the initiatives overview, making it easy to compare it across your initiatives.
You can now change the end date of a live survey or add more teams to it.
Survey reminders are now sent only on weekdays. You can see the exact times when creating a survey.
Subscribe to our newsletter
Get the latest product updates and #goodreads delivered to your inbox once a month.