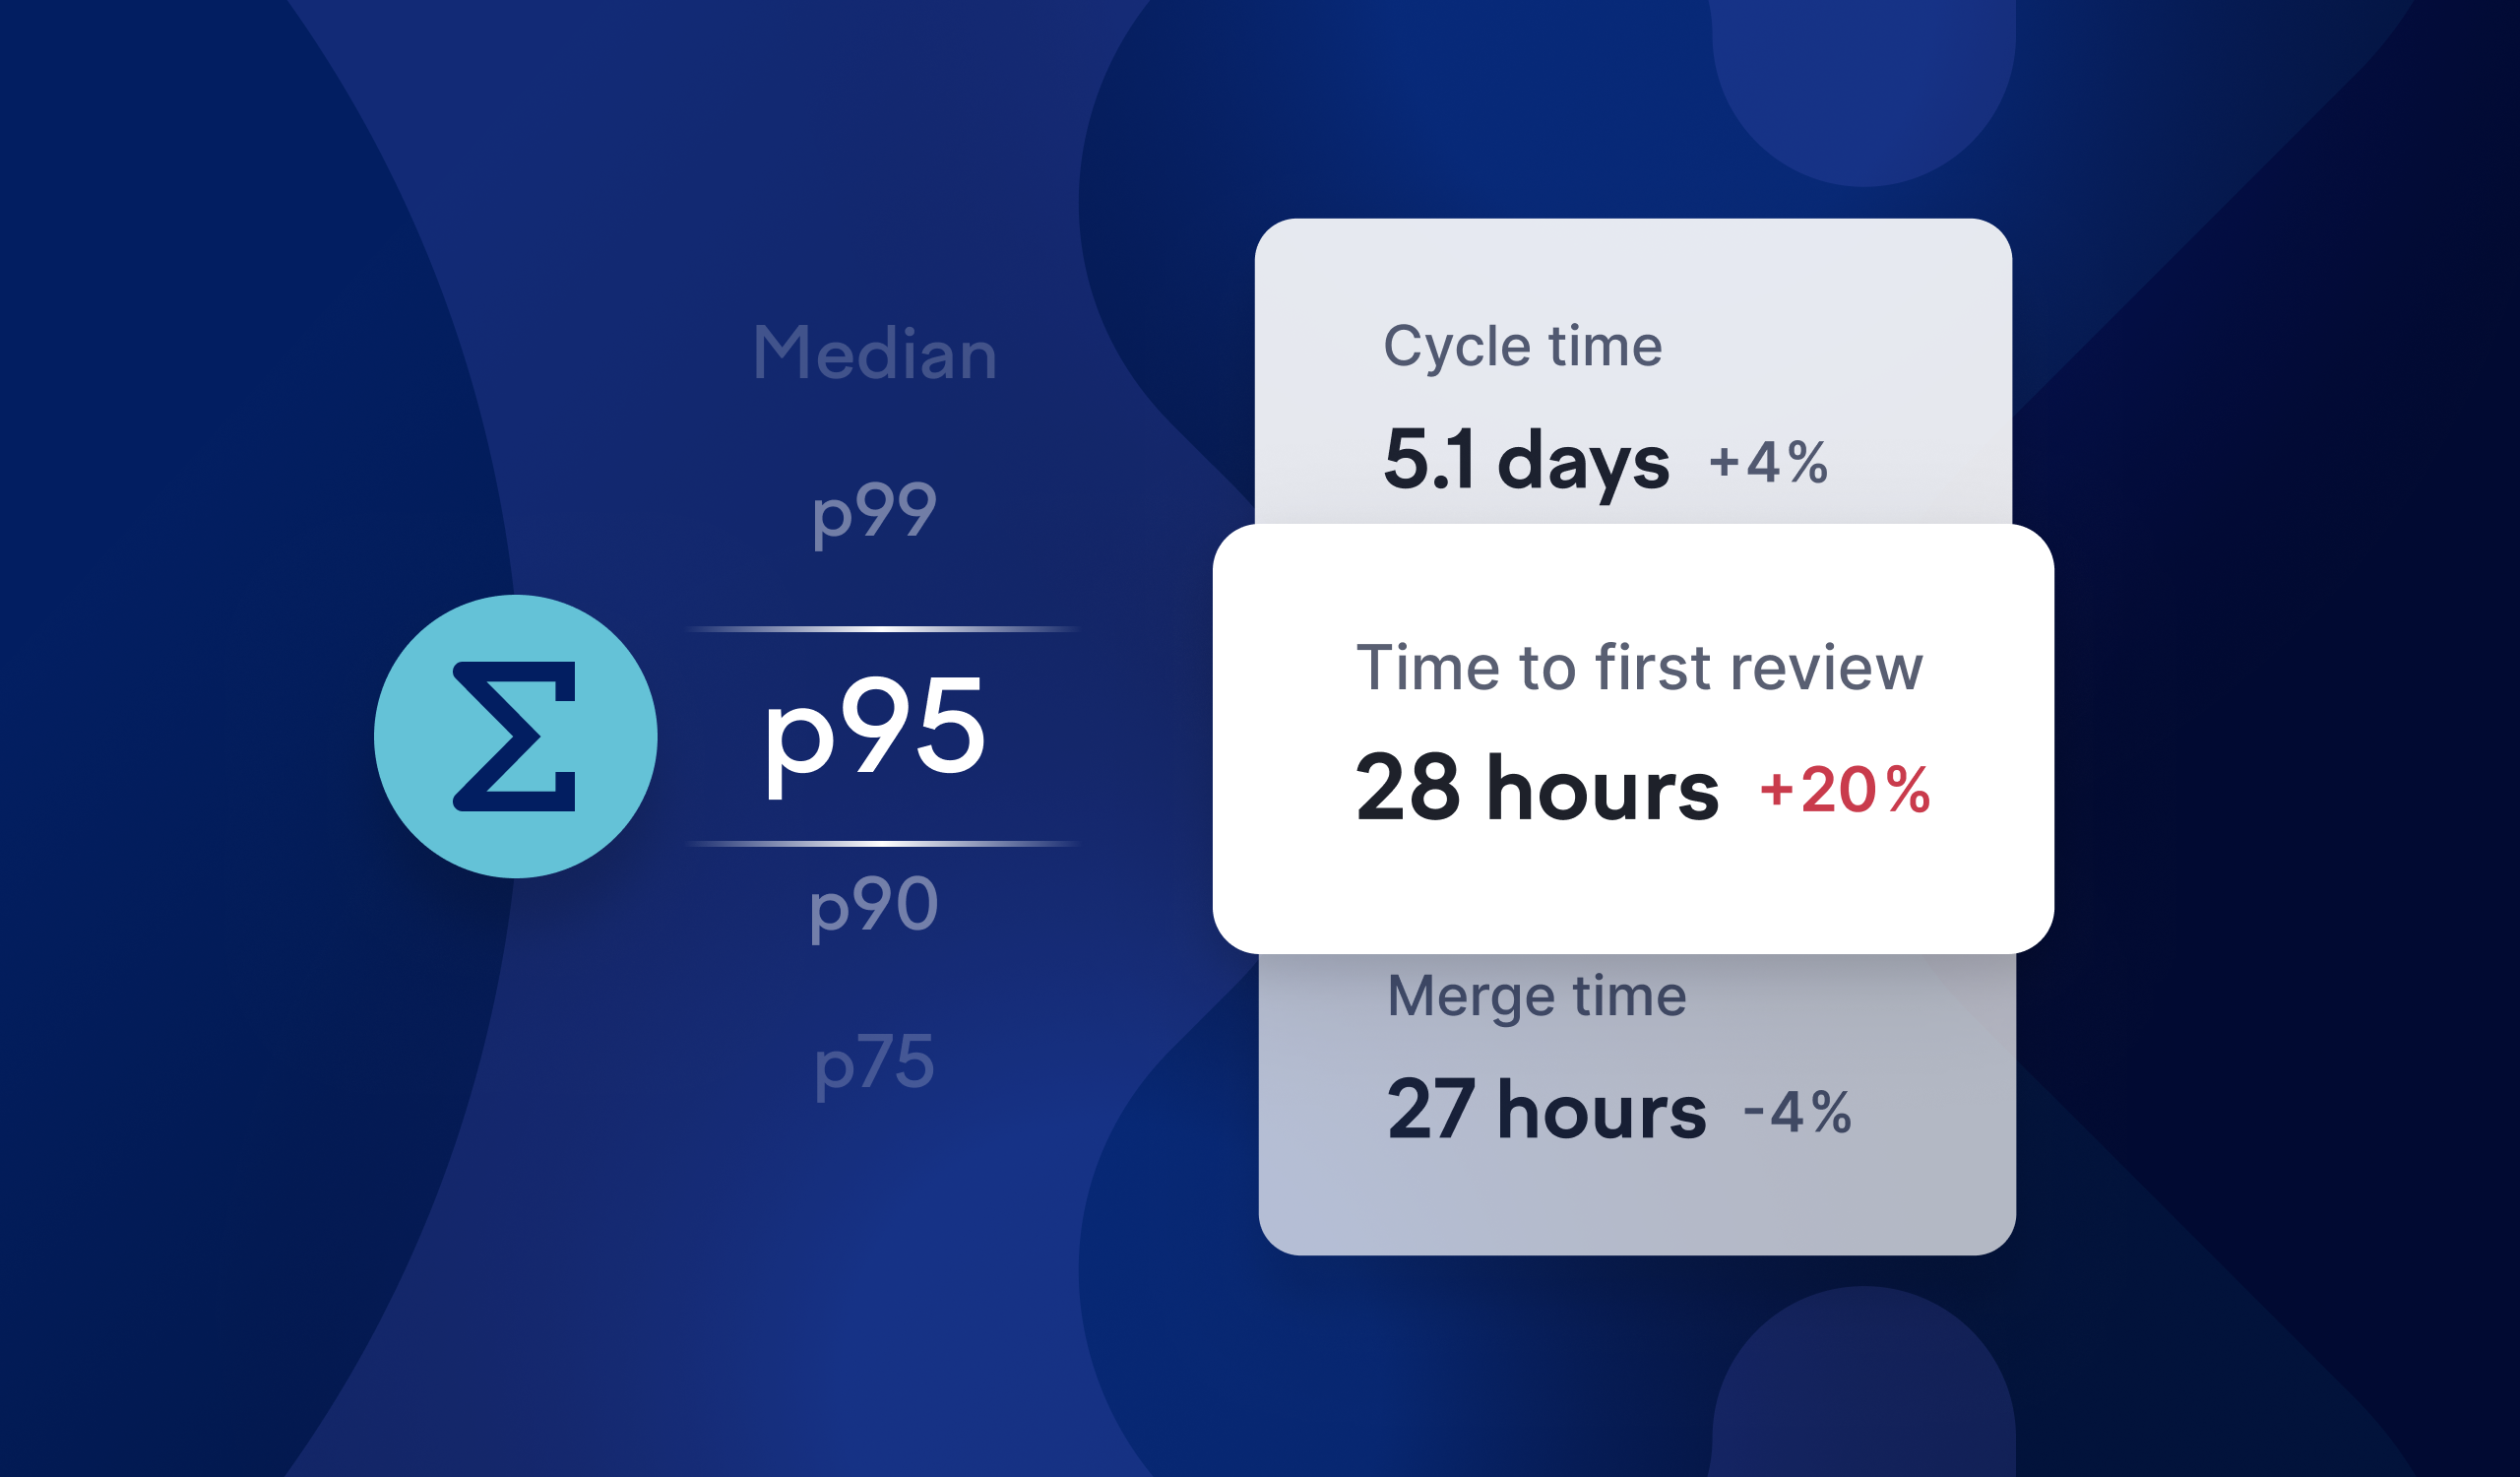
You can now view metrics using percentiles instead of just averages. In the code metrics view, you’ll find a new dropdown that lets you switch between different aggregation methods, including median (p50), p75, p90, p95, and p99.
Averages can hide important patterns in your data and are easily skewed by outliers. Percentiles give you a clearer picture of what’s typical and help you spot edge cases. For example, use median to understand typical cycle time, p90 to see how fast most pull requests get their first review, or p99 to detect merge time outliers.
Try it out by opening the code metrics view and selecting your preferred aggregation method from the dropdown. In the coming weeks, we’ll bring percentiles to other metrics views as well.
More updates
If you’re using GitHub and GitLab in your organization, you can now see code metrics for both.
You’re now able to see more accurate historical metrics for teams, taking membership changes into account.
We’ve made small updates to some code metrics definitions to more accurately reflect your work, so some numbers may slightly differ from what you’ve seen in the past.
Subscribe to our newsletter
Get the latest product updates and #goodreads delivered to your inbox once a month.