Spot bottlenecks faster with the new issue details tab
When you’re trying to improve your team’s cycle time, knowing that an issue took two weeks isn’t enough — you need to know why. That’s why we’re introducing a new details tab in the issue view, with a cycle time breakdown that shows exactly how long an issue spent in each stage of development.
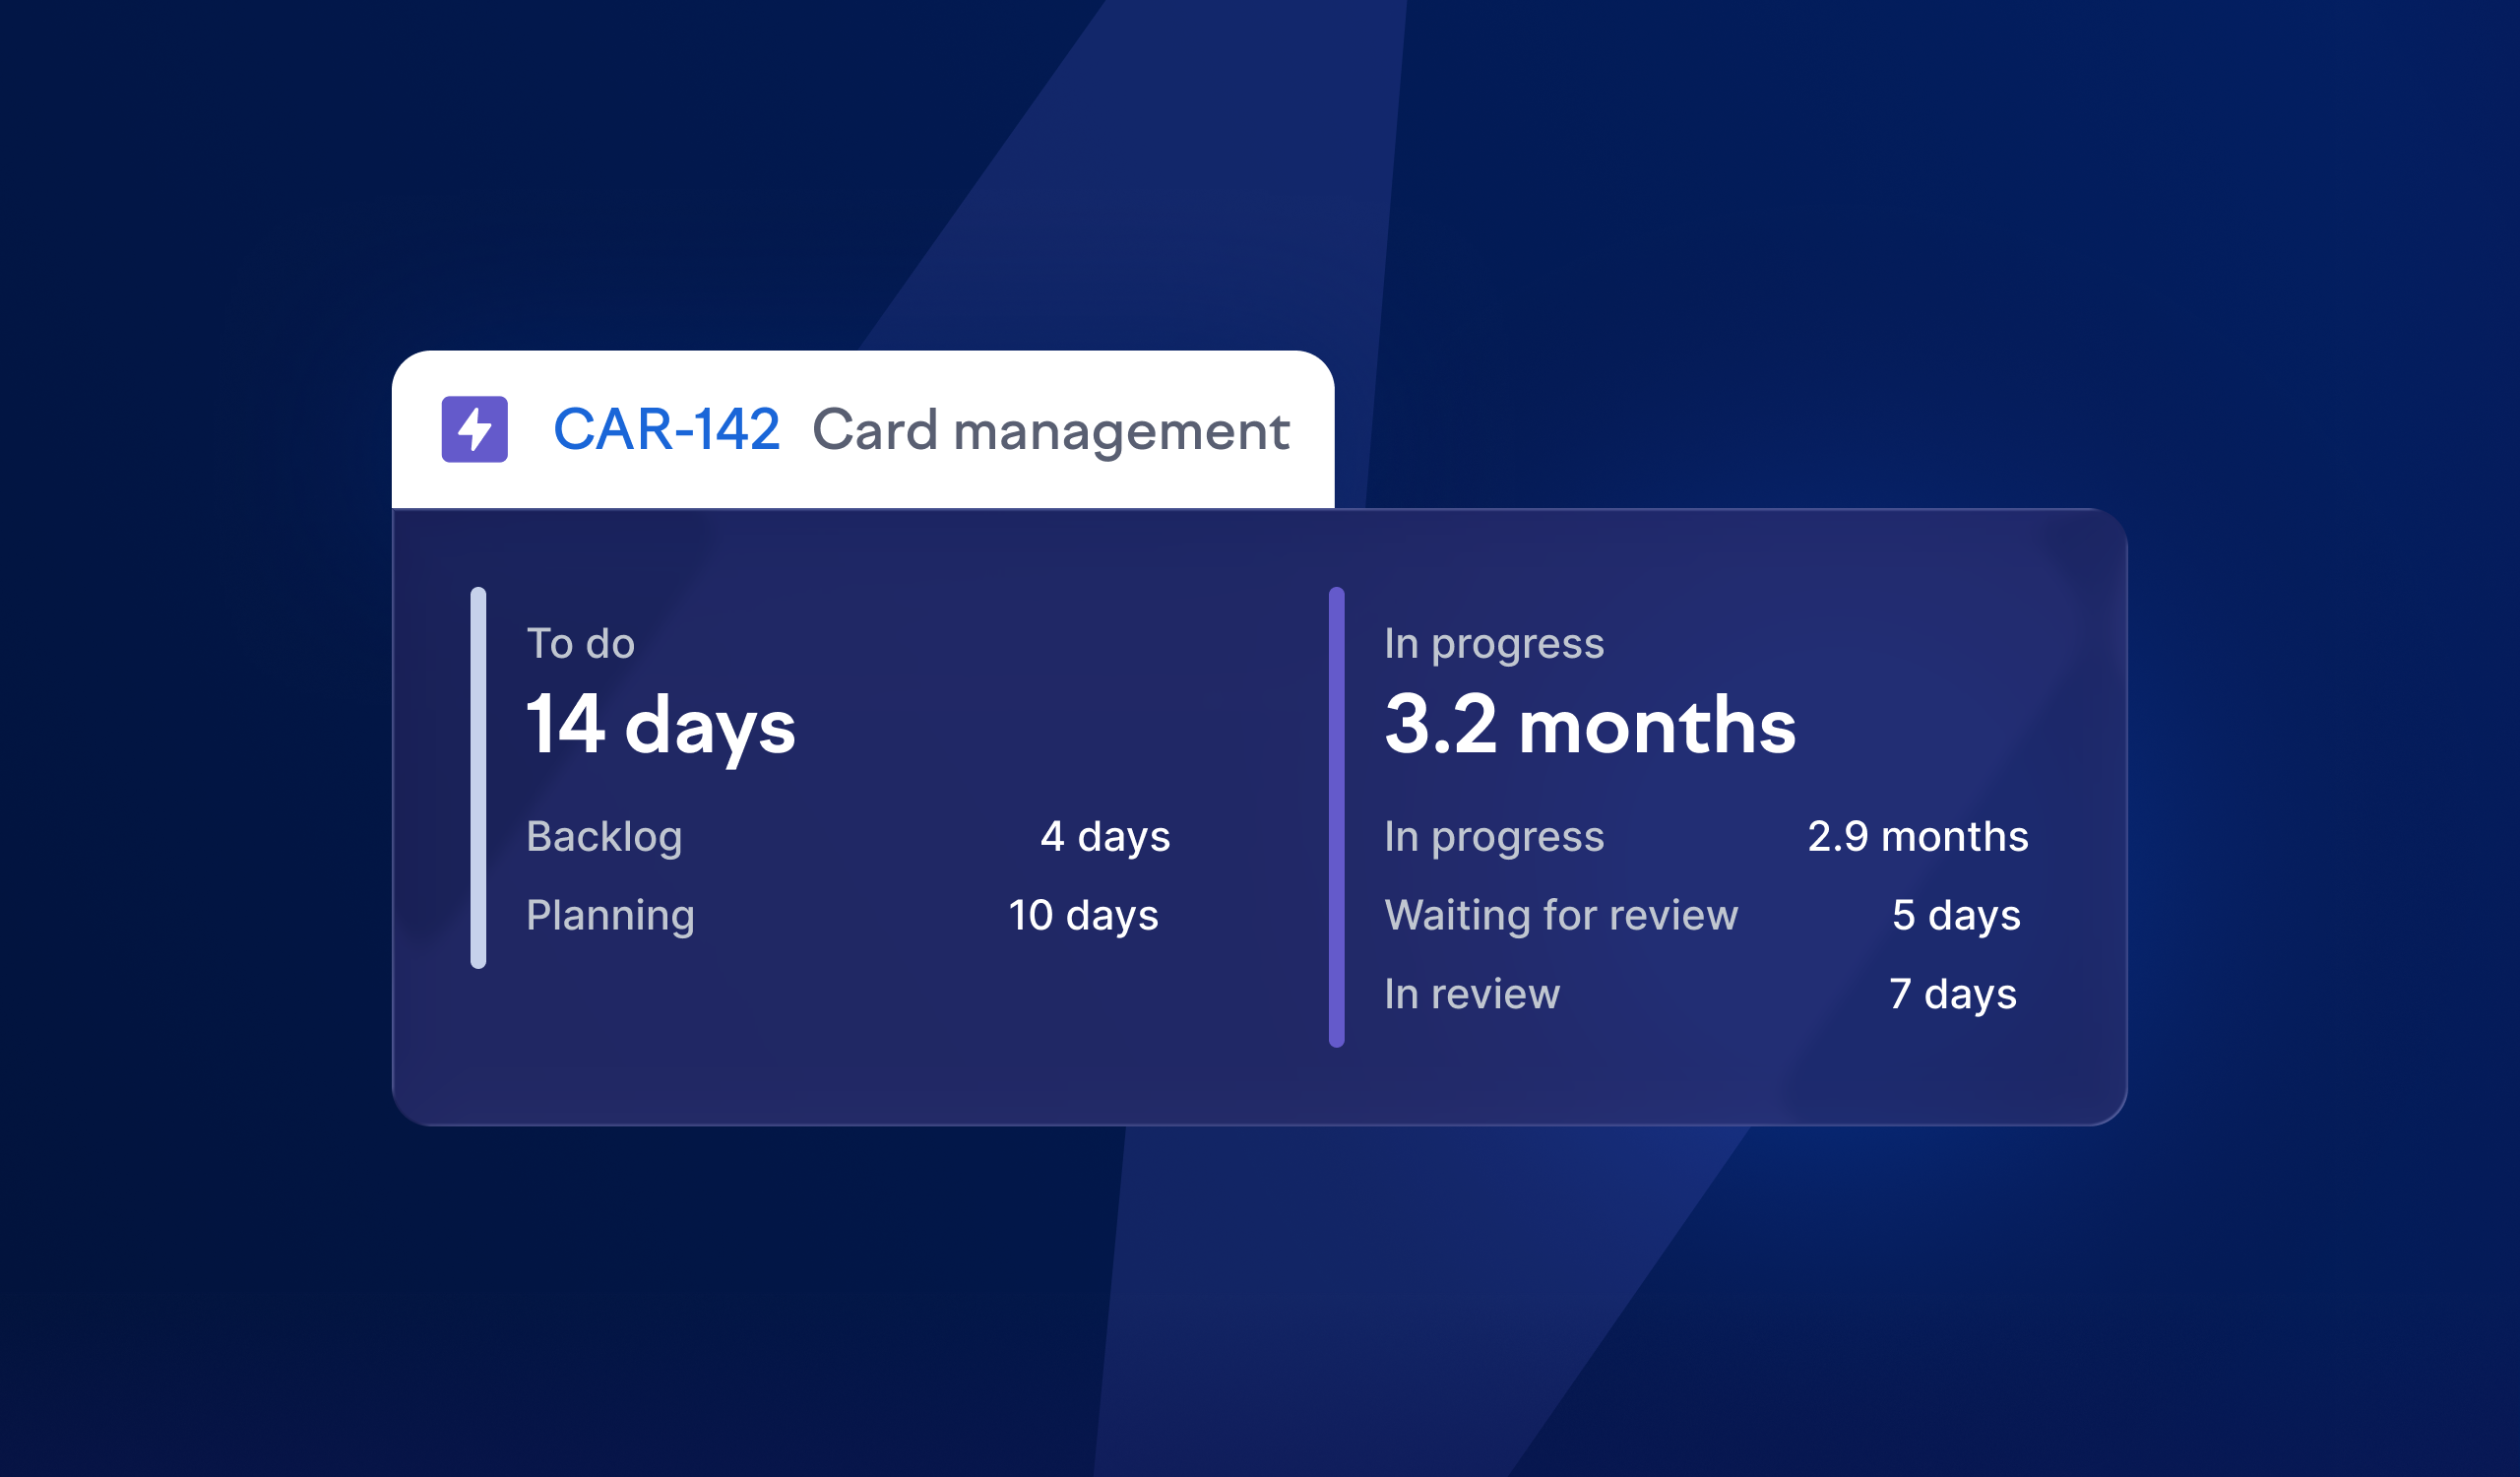
Issue cycle time breakdown [open beta]
The cycle time breakdown groups your Jira statuses into Swarmia’s to do / in progress / done stages and then shows how each of your source statuses contributed to the time spent in each stage. This makes it easy to spot bottlenecks that averages tend to hide. If an issue had a long cycle time, you can now check whether it was stuck in development, waiting for review, or held up in testing.
This is especially useful if your team has modeled your process in detail using multiple in-progress statuses, separate review and QA statuses, or custom stages beyond the basic flow.
The issue cycle time breakdown is available in open beta for Jira users. To try it, open any issue and navigate to the details tab.
Issue details tab
The details tab brings all the key attributes of an issue into a single place. You’ll find the issue type, status, creation, started, and completed dates, as well as issue ownership.
The details tab is available to all Swarmia users. Open any issue and select the details tab to get started.
Subscribe to our newsletter
Get the latest product updates and #goodreads delivered to your inbox once a month.