Chances are your AI tool spend has gone up this year. Chances are also that someone has asked you what you’re getting for all those tokens.
In principle, this is easy:
ROI=costgains−cost
In practice, there are two problems.
Problem 1: Gains in what?
Lines of code? People figured out in the 80’s that this isn’t a great metric to optimize alone. Reward lines of code, and you’ll start solving simple problems in complicated ways. Plus, the whole point is to solve a problem with as little code as possible. Next.
Pull requests? Better, but not all pull requests are equal. Some are one-line fixes, some are week-long refactorings. And even a ‘big’ pull request isn’t worth much if it doesn’t solve a user problem or create more revenue. A one-line fix could save a key customer account, which is far more valuable than a ‘bigger’ pull request.
Stories and epics? These are closest to user problems and business value. But they’re not a standard unit, and some work never makes it to the issue tracker. Hotfixes and small improvements often ship as PRs with no linked issue.
Flow metrics? PR cycle time, review time, deployment frequency. These are useful leading indicators. If PRs are moving faster, something is working. But they measure how smoothly work flows, not how much of it gets done or whether it mattered.
If you’ve been around this space, you know where this is going: there’s no single productivity metric in software development. And even if you found one, Goodhart’s law would ruin it for you. When a measure becomes a target, it stops being a good measure.
Developer experience? You can survey your developers, ask how they feel about the AI tools, and even turn that into a composite score. I’m convinced developer experience is worth investing in. But I can’t really tell you what a 1.4-point bump is in dollars.
Time saved? This one avoids most of the pitfalls above. If AI saves 20% of your engineers’ time, you can assume they use that time for something useful. And time is easy to measure. You have a clock.
The catch, however: to know how much time you saved, you need to know how long the task would have taken without AI. You don’t have that number, which brings us to the second problem.
Problem 2: Compared to what?
Self-assessment? This is the most common approach. After a task, developers estimate how much time AI saved them. Easy done.
The downside is that people are rather bad at this. In METR’s randomized controlled trial last year, experienced developers estimated AI made them about 20% faster. In reality, it made them about 20% slower.
Segmenting people? Compare heavy AI users, light users, and non-users. Say your heavy users ship 40% more PRs. Great, but does spending more tokens make you a more effective developer? Or do more effective developers spend more tokens? Or do more effective developers actually spend less tokens because they know which models to use? You can’t tell which way the causality runs.
Segmenting work? Compare PRs built with heavy AI use to PRs built without. Same issue. Did spending tokens on a PR make it bigger, or did you spend more because it was a harder task? You end up with an inconclusive result.
The honest answer is that there’s seldom a randomized control group, unless you set one up yourself. That’s a big project, and few organizations are willing to do it.
It’s also getting harder to find “no AI” anywhere. METR ran a follow-up study and struggled to find volunteers who would work without AI, even when they got to pick their own tasks, and even when they got paid $50 an hour.
The past? You used AI less before and more now, so you compare the two periods.
This is the most practical option, but you need to be careful with alternative explanations. Between the two periods, you probably also reorganized a team or two, hired some people, changed your development process, and had a summer holiday season. Any of those could explain a change in throughput.
Then again, AI coding tools are probably the biggest change in your development process lately. So they surely explain at least some of what you see.
One way to do it anyway
I don’t want to only complain, so here’s my best attempt at an ROI formula you can actually use:
ROI=AI spend%increase in throughput×developer cost−AI spend
For throughput, I wouldn’t pick just one metric. Look at lines of code, pull requests, and issues side by side, normalized per full-time engineer. This way, there are three variables instead of one.
For the baseline, I’d compare to the past. It’s not perfect science, but it’s a real number, and at least you’re aware of the flaws and caveats. You know what changed and when, so you can at least argue about what else changed.
Let’s run the numbers for an imaginary company. It has 20 engineers who cost $3M a year in total. It spends $500 per engineer per month on AI coding tools, so $120k a year. Compared to a year ago, lines of code per engineer are up 40%, PRs are up 10%, and completed stories are down 15%.
Lines of code:Pull requests:Stories:$120k0.40×$3M−$120k=9×$120k0.10×$3M−$120k=1.5×$120k−0.15×$3M−$120k=−4.75×
Depending on which lens you pick, AI is either the best investment the company ever made or a money pit. Which number is right? All of them, sort of. The spread itself tells you how AI is changing the shape of work: code per PR went up, so pull requests are getting bigger, and each one still needs a human to review it. PRs per story went up too, which means the constraint has moved somewhere outside of coding, like scoping or waiting on a release. So you should probably talk about it.
Turning the formula around
The before-and-after comparison has a clear flaw. Your “no AI” period might be two years ago by now. It’s hard to pick a fair time frame, and it’s hard to spot small changes in a continuous process.
So I prefer to take the same inputs and organize them differently. Instead of ROI, look at the total cost of throughput: developer cost plus AI spend, divided by throughput. Then follow the trend.
total cost of throughput=throughputdeveloper cost+AI spend
Back to our company. Last year, 4,000 merged PRs cost $3M, so $750 per PR. This year, 4,400 PRs cost $3.12M, so $709 per PR. AI spend went up, but PR throughput went up more. Cost per PR went down 5%.
Last year:This year:4,000PRs$3M+$0=$750per PR4,400PRs$3M+$120k=$709per PR
Stories tell a different story. Last year, our company had 1,000 completed stories that cost $3,000 each. This year, 850 stories cost $3,671 each, an increase of 22%.
Last year:This year:1,000stories$3M+$0=$3,000per story850stories$3M+$120k=$3,671per story
Three trend lines like this are much easier to follow than a one-off ROI percentage. And they raise better questions. Why are we merging more PRs but finishing fewer stories? Is the work getting split differently? Is more of it going untracked? Or are we just busier without getting more done?
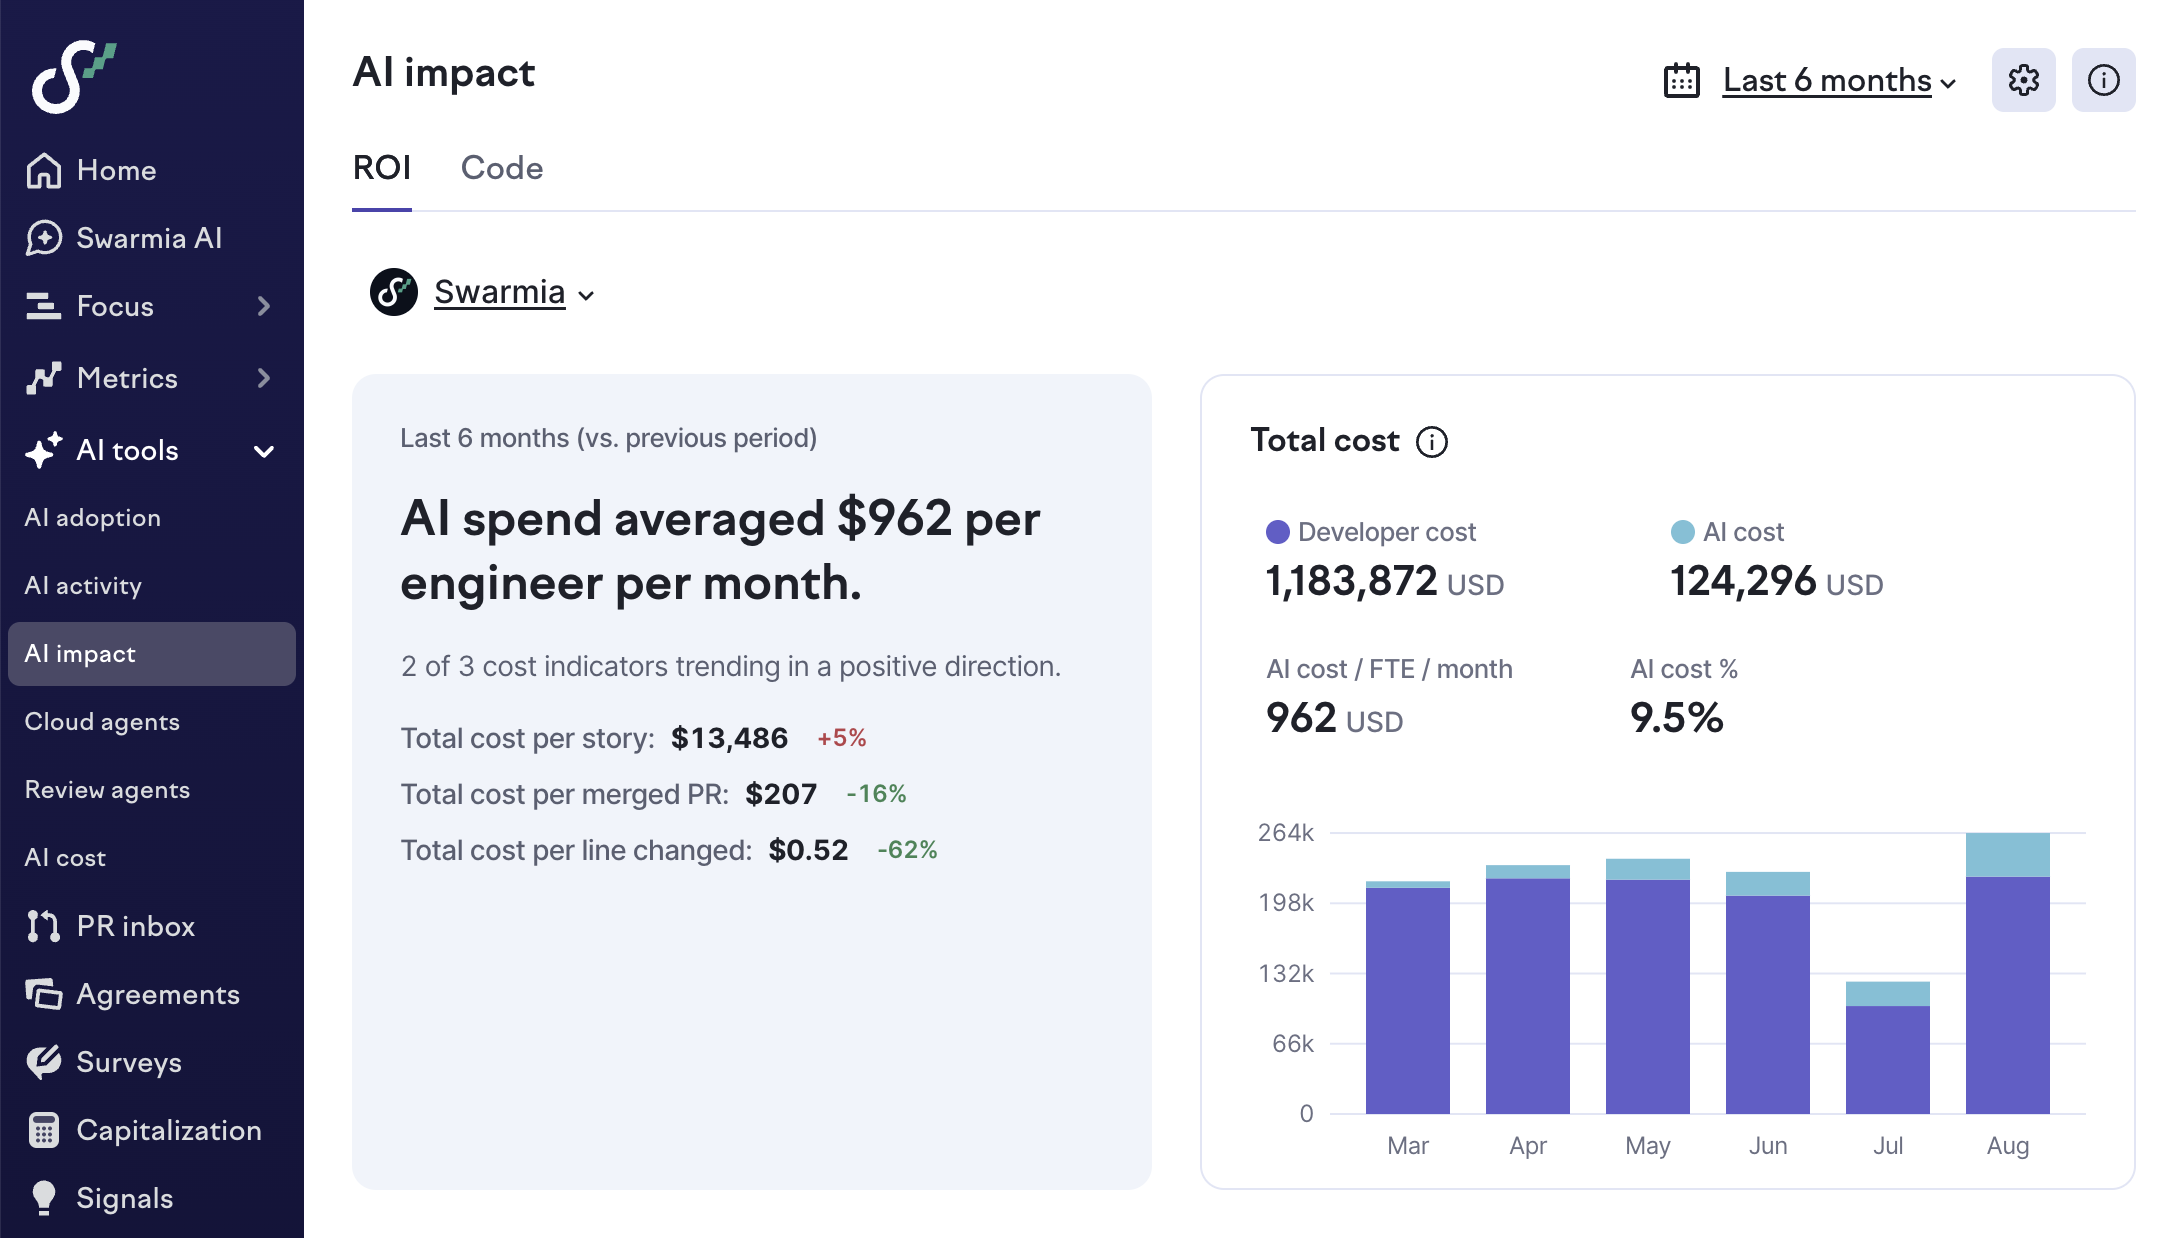
The AI impact view in Swarmia showing total cost per story, per merged PR, and per line changed, alongside developer cost and AI cost over the last six months.
Two caveats
Control for quality. Going faster while producing worse code is not what I’d call productivity. Keep an eye on change failure rate, bug backlog, and the share of keeping-the-lights-on (KTLO) work in your investment balance. If cost per PR drops 5% but the KTLO share climbs from 10% to 25%, the savings are borrowed, not earned.
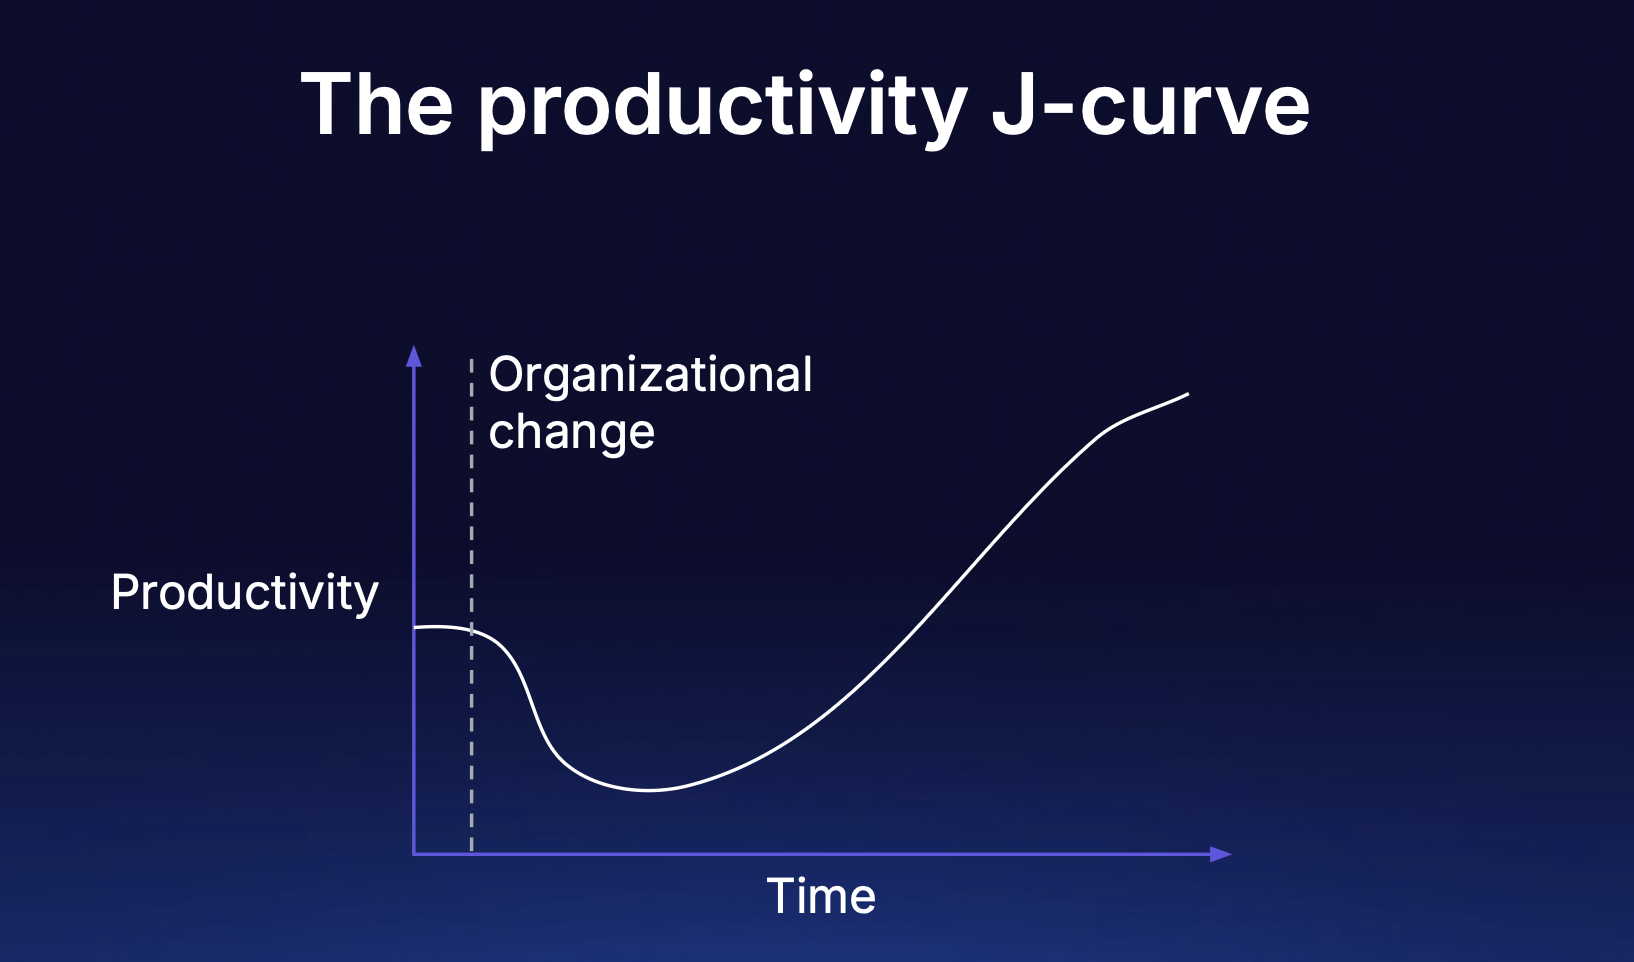
Expect a dip first. AI tools aren’t a light switch. Many organizations see productivity go down before it goes up. People need to learn the tools, and the team needs to change its process and practices to get the gains out.
The productivity J-curve: productivity dips after an organizational change before rising above where it started.
That’s why I’d hold off on the ROI calculation until you’ve figured out whether you’re set up for success at all. We just published the Build framework to help with exactly this. It has three areas:
AI leverage. Are you creating the conditions for AI tools to work? Measured by adoption, readiness, autonomy, and culture.
Effectiveness. Are you delivering value faster, and is the pace sustainable? Measured by productivity, quality, and developer experience.
Return on engineering. What business value does your engineering investment produce? Measured by business outcomes and engineering cost.
Return on engineering is where the numbers we’ve just worked out together live. However, alongside cost per unit of work, we also recommend looking at business outcomes: how much you invest in new features versus maintenance, how much work links to organizational initiatives, and whether you actually finish those initiatives.
The number nobody asked for
Ok, back to the person who wants to know what you’re getting for all those tokens.
You could give them one number. 9x ROI, say. It sounds pretty impressive, and it’s easy to whack on a slide deck.
But what happens when a couple of months later that same person notices the backlog has doubled, and now your one number is wrong? And oh no, you only had one number!
This is exactly why a few numbers, tracked over time, ideally that are in tension with each other, are a much better bet.
Sure, you might have to translate engineering language into business language (like saying “we’re releasing features to customers at a lower cost than previously” instead of “cost per story is down”) but it’s better for everyone to see the tradeoffs, not just the headline.
So instead of 9x, you’d go back to that person with something like: cost per PR is down 5%, cost per story is up 22%, and here’s what we think is happening between the two. It makes for a less exciting slide, admittedly, but it’s one you won’t have to take back a couple of months later, and it gets you into a conversation about what’s actually going on with the work.
Here, a framework for those numbers
The Build framework turns the messy question of AI impact into three areas that tell a more complete story.

'%20stroke='url(%23paint1_linear_110_4764)'%20stroke-width='0.5'/%3e%3cdefs%3e%3clinearGradient%20id='paint0_linear_110_4764'%20x1='19.651'%20y1='5.88916'%20x2='19.651'%20y2='27.8676'%20gradientUnits='userSpaceOnUse'%3e%3cstop%20offset='0.1'%20stop-color='%235549C2'/%3e%3cstop%20offset='0.9'%20stop-color='%2370C9E4'/%3e%3c/linearGradient%3e%3clinearGradient%20id='paint1_linear_110_4764'%20x1='19.651'%20y1='5.88916'%20x2='19.651'%20y2='27.8676'%20gradientUnits='userSpaceOnUse'%3e%3cstop%20stop-color='%234D3DDD'/%3e%3cstop%20offset='0.322115'%20stop-color='%2364CDED'/%3e%3cstop%20offset='0.5'%20stop-color='%23736CFF'/%3e%3cstop%20offset='0.75'%20stop-color='%2364CDED'/%3e%3cstop%20offset='1'%20stop-color='%234D3DDD'/%3e%3c/linearGradient%3e%3c/defs%3e%3c/svg%3e)


'%20stroke='url(%23paint1_linear_110_4820)'%20stroke-width='0.5'/%3e%3cdefs%3e%3clinearGradient%20id='paint0_linear_110_4820'%20x1='20.0002'%20y1='4.11661'%20x2='20.0002'%20y2='33.8832'%20gradientUnits='userSpaceOnUse'%3e%3cstop%20offset='0.1'%20stop-color='%235549C2'/%3e%3cstop%20offset='0.9'%20stop-color='%2370C9E4'/%3e%3c/linearGradient%3e%3clinearGradient%20id='paint1_linear_110_4820'%20x1='20.0002'%20y1='4.11661'%20x2='20.0002'%20y2='33.8832'%20gradientUnits='userSpaceOnUse'%3e%3cstop%20stop-color='%234D3DDD'/%3e%3cstop%20offset='0.322115'%20stop-color='%2364CDED'/%3e%3cstop%20offset='0.5'%20stop-color='%23736CFF'/%3e%3cstop%20offset='0.75'%20stop-color='%2364CDED'/%3e%3cstop%20offset='1'%20stop-color='%234D3DDD'/%3e%3c/linearGradient%3e%3c/defs%3e%3c/svg%3e)

'%3e%3cpath%20d='M12.9414%2023.0626C12.6251%2023.0626%2012.3687%2023.319%2012.3687%2023.6354L12.3687%2025.1077C12.3687%2025.424%2012.6251%2025.6805%2012.9414%2025.6805H12.9868C14.4524%2025.6805%2016.6386%2025.6805%2018.1041%2025.6805H18.1622C18.4785%2025.6805%2018.735%2025.424%2018.735%2025.1077L18.735%2023.6354C18.735%2023.319%2018.4785%2023.0626%2018.1622%2023.0626H12.9414Z'%20fill='%23899FCF'/%3e%3cpath%20d='M18.7514%2020.8724C18.7514%2020.0855%2019.1849%2019.3779%2019.764%2018.8452C21.016%2017.6937%2021.8005%2016.0418%2021.8005%2014.2067C21.8005%2010.727%2018.9796%207.90607%2015.4999%207.90607C12.0202%207.90607%209.19928%2010.727%209.19928%2014.2067C9.19928%2016.0435%209.9853%2017.6968%2011.2393%2018.8484C11.8181%2019.3799%2012.2511%2020.0866%2012.2511%2020.8724C12.2511%2021.1887%2012.5076%2021.4452%2012.8239%2021.4452H18.1786C18.495%2021.4452%2018.7514%2021.1887%2018.7514%2020.8724Z'%20fill='%23899FCF'/%3e%3c/g%3e%3cdefs%3e%3cclipPath%20id='clip0_111_18741'%3e%3crect%20width='19'%20height='19'%20fill='white'%20transform='translate(6%207.29321)'/%3e%3c/clipPath%3e%3c/defs%3e%3c/svg%3e)

'%3e%3cpath%20fill-rule='evenodd'%20clip-rule='evenodd'%20d='M24.0701%207.72604L20.7065%207.72604C20.3309%207.72604%2020.0265%208.03047%2020.0265%208.40599L20.0265%2011.7696C20.0265%2011.9911%2020.1324%2012.1879%2020.2964%2012.312L18.6479%2015.609L17.4892%2015.609L17.4944%2015.6038C16.454%2015.6038%2016.3965%2014.6207%2016.3934%2014.5122L16.3934%2012.3475C16.3934%2011.972%2016.089%2011.6676%2015.7134%2011.6676L12.3498%2011.6676C11.9743%2011.6676%2011.6699%2011.972%2011.6699%2012.3475L11.6699%2015.7111C11.6699%2015.748%2011.6728%2015.7842%2011.6785%2015.8195L9.81296%2019.5505L7.92995%2019.5505C7.55442%2019.5505%207.25%2019.8549%207.25%2020.2305L7.25%2023.594C7.25%2023.9696%207.55442%2024.274%207.92995%2024.274L11.2935%2024.274C11.6691%2024.274%2011.9735%2023.9696%2011.9735%2023.594L11.9735%2020.2305C11.9735%2020.0089%2011.8675%2019.8121%2011.7035%2019.688L13.352%2016.3911L14.6282%2016.3911C15.5514%2016.4636%2015.6058%2017.3707%2015.609%2017.4775L15.609%2019.6526C15.609%2020.0281%2015.9135%2020.3325%2016.289%2020.3325L19.6526%2020.3325C20.0281%2020.3325%2020.3325%2020.0281%2020.3325%2019.6526L20.3325%2016.289C20.3325%2016.2508%2020.3294%2016.2133%2020.3233%2016.1768L22.187%2012.4495L24.0701%2012.4495C24.4456%2012.4495%2024.75%2012.1451%2024.75%2011.7696L24.75%208.40599C24.75%208.03047%2024.4456%207.72604%2024.0701%207.72604Z'%20fill='%23899FCF'/%3e%3c/g%3e%3cdefs%3e%3cclipPath%20id='clip0_2772_12454'%3e%3crect%20width='20'%20height='20'%20fill='white'%20transform='translate(6%206)'/%3e%3c/clipPath%3e%3c/defs%3e%3c/svg%3e)


'%3e%3cpath%20d='M14.5615%2031.9046H25.9297C26.5036%2031.9046%2026.9697%2032.3701%2026.9697%2032.9437V35.7552L26.9639%2035.8616C26.9104%2036.3852%2026.4676%2036.7933%2025.9297%2036.7933H25.8037C25.1902%2036.7934%2024.6569%2037.0835%2024.1855%2037.4368C23.9487%2037.6144%2023.7206%2037.8125%2023.5029%2038.0062C23.2832%2038.2016%2023.0755%2038.3909%2022.8682%2038.5589C22.5182%2038.8424%2022.0724%2039.012%2021.5869%2039.012H18.8779C18.3922%2039.012%2017.9456%2038.8424%2017.5957%2038.5589C17.3883%2038.3909%2017.1806%2038.2016%2016.9609%2038.0062C16.7434%2037.8126%2016.516%2037.6143%2016.2793%2037.4368C15.8668%2037.1275%2015.4065%2036.8672%2014.8867%2036.8069L14.6611%2036.7933H14.5615C13.9879%2036.7931%2013.5235%2036.3288%2013.5234%2035.7552V32.9437C13.5235%2032.3701%2013.9878%2031.9047%2014.5615%2031.9046ZM20.3848%200.98761C27.847%200.98761%2033.8963%207.03716%2033.8965%2014.4993C33.8965%2018.4346%2032.2143%2021.9769%2029.5293%2024.4466C28.2431%2025.6297%2027.258%2027.2224%2027.2578%2029.014V29.015C27.2575%2029.5885%2026.7914%2030.054%2026.2178%2030.054H14.5586C13.985%2030.054%2013.5188%2029.5885%2013.5186%2029.015V29.014C13.5183%2027.2247%2012.5334%2025.6349%2011.248%2024.4544C8.55856%2021.9844%206.87305%2018.4383%206.87305%2014.4993C6.8732%207.03726%2012.9227%200.987767%2020.3848%200.98761ZM20.0518%2018.6585C19.6614%2018.6587%2019.3447%2018.976%2019.3447%2019.3665V26.6859C19.345%2027.0761%2019.6615%2027.3927%2020.0518%2027.3929H20.7178C21.1082%2027.3929%2021.4245%2027.0762%2021.4248%2026.6859V19.3665C21.4248%2018.9759%2021.1084%2018.6585%2020.7178%2018.6585H20.0518Z'%20fill='url(%23paint0_linear_166_518)'%20stroke='url(%23paint1_linear_166_518)'%20stroke-width='0.416667'/%3e%3c/g%3e%3cdefs%3e%3clinearGradient%20id='paint0_linear_166_518'%20x1='20.3849'%20y1='0.779602'%20x2='20.3849'%20y2='39.2204'%20gradientUnits='userSpaceOnUse'%3e%3cstop%20offset='0.1'%20stop-color='%235549C2'/%3e%3cstop%20offset='0.9'%20stop-color='%2370C9E4'/%3e%3c/linearGradient%3e%3clinearGradient%20id='paint1_linear_166_518'%20x1='20.3849'%20y1='0.779602'%20x2='20.3849'%20y2='39.2204'%20gradientUnits='userSpaceOnUse'%3e%3cstop%20stop-color='%234D3DDD'/%3e%3cstop%20offset='0.322115'%20stop-color='%2364CDED'/%3e%3cstop%20offset='0.5'%20stop-color='%23736CFF'/%3e%3cstop%20offset='0.75'%20stop-color='%2364CDED'/%3e%3cstop%20offset='1'%20stop-color='%234D3DDD'/%3e%3c/linearGradient%3e%3cclipPath%20id='clip0_166_518'%3e%3crect%20width='40'%20height='40'%20fill='white'/%3e%3c/clipPath%3e%3c/defs%3e%3c/svg%3e)


'%3e%3cpath%20d='M31.01%204.32568C29.1716%207.09907%2027.894%209.22748%2027.1194%2010.8218C26.607%2011.8752%2026.3824%2012.5664%2026.2971%2013.019C26.2127%2013.467%2026.2606%2013.7057%2026.3293%2013.8325V13.8335L26.3323%2013.8384C26.3498%2013.8686%2026.3918%2013.9371%2026.4934%2013.9897C26.5848%2014.0371%2026.7072%2014.0629%2026.8733%2014.063C27.2288%2014.063%2027.6883%2013.9506%2028.2385%2013.7456C28.7927%2013.5391%2029.4565%2013.2322%2030.2258%2012.8267C31.7308%2012.0333%2033.655%2010.8562%2035.9875%209.3042L36.3762%209.79346C34.0139%2012.0094%2032.1768%2013.8719%2030.9241%2015.5464C29.6466%2017.2539%2028.9592%2018.7892%2028.9592%2020.3247V20.5327H28.9709C29.0302%2021.999%2029.7102%2023.4718%2030.9299%2025.1021C32.1828%2026.7767%2034.0204%2028.6388%2036.3831%2030.855L35.9924%2031.3442C33.66%2029.7923%2031.7356%2028.6151%2030.2307%2027.8218C29.4616%2027.4163%2028.7984%2027.1093%2028.2444%2026.9028C27.6942%2026.6978%2027.2346%2026.5854%2026.8792%2026.5854C26.7132%2026.5855%2026.5907%2026.6114%2026.4993%2026.6587C26.3975%2026.7114%2026.3556%2026.7809%2026.3381%2026.811L26.3352%2026.8149C26.2662%2026.9414%2026.2184%2027.179%2026.303%2027.6274C26.3883%2028.0793%2026.6129%2028.7705%2027.1252%2029.8267C27.8998%2031.4207%2029.1724%2033.5483%2031.0159%2036.3218L30.5256%2036.7114C28.3119%2034.3499%2026.4515%2032.5118%2024.7776%2031.2583C23.0705%2029.98%2021.5349%2029.2915%2019.9983%2029.2915C18.4617%2029.2915%2016.9261%2029.98%2015.219%2031.2583C13.545%2032.5119%2011.6839%2034.3496%209.46997%2036.7114L8.97974%2036.3218C10.818%2033.5485%2012.0967%2031.4209%2012.8713%2029.8267C13.3835%2028.7736%2013.6082%2028.083%2013.6936%2027.6304C13.7782%2027.1812%2013.7304%2026.9415%2013.6614%2026.8149L13.6584%2026.811L13.6096%2026.7437C13.5843%2026.716%2013.5483%2026.6851%2013.4973%2026.6587C13.4059%2026.6114%2013.2834%2026.5855%2013.1174%2026.5854C12.7619%2026.5854%2012.303%2026.6978%2011.7532%2026.9028C11.1995%2027.1093%2010.5367%2027.4163%209.76782%2027.8218C8.26358%2028.6151%206.33836%2029.7912%204.00317%2031.3433L3.61841%2030.855C5.98121%2028.6386%207.81958%2026.7767%209.07251%2025.1021C10.3498%2023.3947%2011.0372%2021.86%2011.0374%2020.3247C11.0374%2018.7892%2010.35%2017.2539%209.07251%2015.5464C7.81948%2013.8716%205.9815%2012.0091%203.61841%209.79248L4.00317%209.3042C6.33861%2010.8564%208.26347%2012.0333%209.76782%2012.8267C10.5367%2013.2322%2011.1995%2013.5391%2011.7532%2013.7456C12.303%2013.9506%2012.7619%2014.063%2013.1174%2014.063C13.2835%2014.063%2013.4059%2014.037%2013.4973%2013.9897C13.5988%2013.9372%2013.6409%2013.8687%2013.6584%2013.8384L13.6614%2013.8335C13.7304%2013.707%2013.7783%2013.4696%2013.6936%2013.021C13.6083%2012.5691%2013.3837%2011.8779%2012.8713%2010.8218H12.8704C12.0956%209.22166%2010.8232%207.09888%208.97974%204.32568L9.46997%203.93701C11.6838%206.29874%2013.5434%208.13651%2015.2161%209.39014C16.9217%2010.6684%2018.4559%2011.3578%2019.9924%2011.3579C21.529%2011.3579%2023.0646%2010.6685%2024.7717%209.39014C26.4457%208.13661%2028.3061%206.29858%2030.5198%203.93701L31.01%204.32568Z'%20fill='url(%23paint0_linear_166_603)'%20stroke='url(%23paint1_linear_166_603)'%20stroke-width='0.416667'/%3e%3c/g%3e%3cdefs%3e%3clinearGradient%20id='paint0_linear_166_603'%20x1='20.001'%20y1='3.65479'%20x2='20.001'%20y2='36.9939'%20gradientUnits='userSpaceOnUse'%3e%3cstop%20offset='0.1'%20stop-color='%235549C2'/%3e%3cstop%20offset='0.9'%20stop-color='%2370C9E4'/%3e%3c/linearGradient%3e%3clinearGradient%20id='paint1_linear_166_603'%20x1='20.001'%20y1='3.65479'%20x2='20.001'%20y2='36.9939'%20gradientUnits='userSpaceOnUse'%3e%3cstop%20stop-color='%234D3DDD'/%3e%3cstop%20offset='0.322115'%20stop-color='%2364CDED'/%3e%3cstop%20offset='0.5'%20stop-color='%23736CFF'/%3e%3cstop%20offset='0.75'%20stop-color='%2364CDED'/%3e%3cstop%20offset='1'%20stop-color='%234D3DDD'/%3e%3c/linearGradient%3e%3cclipPath%20id='clip0_166_603'%3e%3crect%20width='33.3333'%20height='33.3333'%20fill='white'%20transform='translate(3.33167%203.65479)'/%3e%3c/clipPath%3e%3c/defs%3e%3c/svg%3e)





'%20fill='white'/%3e%3cpath%20d='M7.19995%2021.6808C7.19995%2020.3553%208.27447%2019.2808%209.59995%2019.2808H38.3999C39.7254%2019.2808%2040.7999%2020.3553%2040.7999%2021.6808V36.0808C40.7999%2037.4062%2039.7254%2038.4808%2038.4%2038.4808H9.59995C8.27447%2038.4808%207.19995%2037.4062%207.19995%2036.0808V21.6808Z'%20fill='%230A328F'/%3e%3cpath%20d='M22.4787%2029.5558L12.0292%2023.407C11.4796%2023.0835%2011.1421%2022.4934%2011.1421%2021.8556V13.8165C11.1421%2012.491%2012.2166%2011.4165%2013.5421%2011.4165H34.4584C35.7838%2011.4165%2036.8584%2012.491%2036.8584%2013.8165V21.8556C36.8584%2022.4934%2036.5209%2023.0835%2035.9712%2023.407L25.5216%2029.5558C24.5826%2030.1084%2023.4178%2030.1084%2022.4787%2029.5558Z'%20fill='%2340D1F1'/%3e%3cpath%20d='M16.8351%2016.5635L31.1649%2016.5635'%20stroke='%230A328F'%20stroke-width='2.4'%20stroke-linecap='round'%20stroke-linejoin='round'/%3e%3cpath%20d='M16.8351%2021.2124L24%2021.1465'%20stroke='%230A328F'%20stroke-width='2.4'%20stroke-linecap='round'%20stroke-linejoin='round'/%3e%3c/svg%3e)


