· Jan 28, 2026
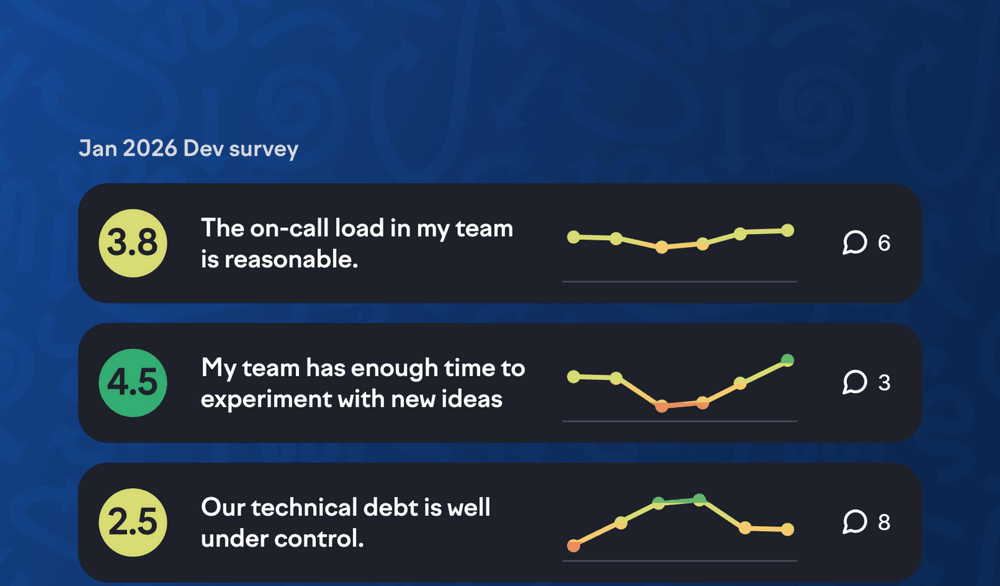
Track survey trends over time
You can now see how survey scores have changed across multiple surveys with the new trend charts. Instead of comparing just two surveys at a time, you can now track progress over many surveys…
Read more→As mentioned in the previous feature update, managing the amount of work in progress is a great way to get work done faster.
New cycle time insights plots completed issues on a timeline and shows how long they were open. The scatter plot makes it easy to identify outliers and trends, and drill down on individual issues.
Can you find correlations between the amount of work in progress and cycle time for your team?
Subscribe to our newsletter
Get the latest product updates and #goodreads delivered to your inbox once a month.
