'%20stroke='url(%23paint1_linear_110_4764)'%20stroke-width='0.5'/%3e%3cdefs%3e%3clinearGradient%20id='paint0_linear_110_4764'%20x1='19.651'%20y1='5.88916'%20x2='19.651'%20y2='27.8676'%20gradientUnits='userSpaceOnUse'%3e%3cstop%20offset='0.1'%20stop-color='%235549C2'/%3e%3cstop%20offset='0.9'%20stop-color='%2370C9E4'/%3e%3c/linearGradient%3e%3clinearGradient%20id='paint1_linear_110_4764'%20x1='19.651'%20y1='5.88916'%20x2='19.651'%20y2='27.8676'%20gradientUnits='userSpaceOnUse'%3e%3cstop%20stop-color='%234D3DDD'/%3e%3cstop%20offset='0.322115'%20stop-color='%2364CDED'/%3e%3cstop%20offset='0.5'%20stop-color='%23736CFF'/%3e%3cstop%20offset='0.75'%20stop-color='%2364CDED'/%3e%3cstop%20offset='1'%20stop-color='%234D3DDD'/%3e%3c/linearGradient%3e%3c/defs%3e%3c/svg%3e)


'%20stroke='url(%23paint1_linear_110_4820)'%20stroke-width='0.5'/%3e%3cdefs%3e%3clinearGradient%20id='paint0_linear_110_4820'%20x1='20.0002'%20y1='4.11661'%20x2='20.0002'%20y2='33.8832'%20gradientUnits='userSpaceOnUse'%3e%3cstop%20offset='0.1'%20stop-color='%235549C2'/%3e%3cstop%20offset='0.9'%20stop-color='%2370C9E4'/%3e%3c/linearGradient%3e%3clinearGradient%20id='paint1_linear_110_4820'%20x1='20.0002'%20y1='4.11661'%20x2='20.0002'%20y2='33.8832'%20gradientUnits='userSpaceOnUse'%3e%3cstop%20stop-color='%234D3DDD'/%3e%3cstop%20offset='0.322115'%20stop-color='%2364CDED'/%3e%3cstop%20offset='0.5'%20stop-color='%23736CFF'/%3e%3cstop%20offset='0.75'%20stop-color='%2364CDED'/%3e%3cstop%20offset='1'%20stop-color='%234D3DDD'/%3e%3c/linearGradient%3e%3c/defs%3e%3c/svg%3e)

'%3e%3cpath%20d='M12.9414%2023.0626C12.6251%2023.0626%2012.3687%2023.319%2012.3687%2023.6354L12.3687%2025.1077C12.3687%2025.424%2012.6251%2025.6805%2012.9414%2025.6805H12.9868C14.4524%2025.6805%2016.6386%2025.6805%2018.1041%2025.6805H18.1622C18.4785%2025.6805%2018.735%2025.424%2018.735%2025.1077L18.735%2023.6354C18.735%2023.319%2018.4785%2023.0626%2018.1622%2023.0626H12.9414Z'%20fill='%23899FCF'/%3e%3cpath%20d='M18.7514%2020.8724C18.7514%2020.0855%2019.1849%2019.3779%2019.764%2018.8452C21.016%2017.6937%2021.8005%2016.0418%2021.8005%2014.2067C21.8005%2010.727%2018.9796%207.90607%2015.4999%207.90607C12.0202%207.90607%209.19928%2010.727%209.19928%2014.2067C9.19928%2016.0435%209.9853%2017.6968%2011.2393%2018.8484C11.8181%2019.3799%2012.2511%2020.0866%2012.2511%2020.8724C12.2511%2021.1887%2012.5076%2021.4452%2012.8239%2021.4452H18.1786C18.495%2021.4452%2018.7514%2021.1887%2018.7514%2020.8724Z'%20fill='%23899FCF'/%3e%3c/g%3e%3cdefs%3e%3cclipPath%20id='clip0_111_18741'%3e%3crect%20width='19'%20height='19'%20fill='white'%20transform='translate(6%207.29321)'/%3e%3c/clipPath%3e%3c/defs%3e%3c/svg%3e)

'%3e%3cpath%20fill-rule='evenodd'%20clip-rule='evenodd'%20d='M24.0701%207.72604L20.7065%207.72604C20.3309%207.72604%2020.0265%208.03047%2020.0265%208.40599L20.0265%2011.7696C20.0265%2011.9911%2020.1324%2012.1879%2020.2964%2012.312L18.6479%2015.609L17.4892%2015.609L17.4944%2015.6038C16.454%2015.6038%2016.3965%2014.6207%2016.3934%2014.5122L16.3934%2012.3475C16.3934%2011.972%2016.089%2011.6676%2015.7134%2011.6676L12.3498%2011.6676C11.9743%2011.6676%2011.6699%2011.972%2011.6699%2012.3475L11.6699%2015.7111C11.6699%2015.748%2011.6728%2015.7842%2011.6785%2015.8195L9.81296%2019.5505L7.92995%2019.5505C7.55442%2019.5505%207.25%2019.8549%207.25%2020.2305L7.25%2023.594C7.25%2023.9696%207.55442%2024.274%207.92995%2024.274L11.2935%2024.274C11.6691%2024.274%2011.9735%2023.9696%2011.9735%2023.594L11.9735%2020.2305C11.9735%2020.0089%2011.8675%2019.8121%2011.7035%2019.688L13.352%2016.3911L14.6282%2016.3911C15.5514%2016.4636%2015.6058%2017.3707%2015.609%2017.4775L15.609%2019.6526C15.609%2020.0281%2015.9135%2020.3325%2016.289%2020.3325L19.6526%2020.3325C20.0281%2020.3325%2020.3325%2020.0281%2020.3325%2019.6526L20.3325%2016.289C20.3325%2016.2508%2020.3294%2016.2133%2020.3233%2016.1768L22.187%2012.4495L24.0701%2012.4495C24.4456%2012.4495%2024.75%2012.1451%2024.75%2011.7696L24.75%208.40599C24.75%208.03047%2024.4456%207.72604%2024.0701%207.72604Z'%20fill='%23899FCF'/%3e%3c/g%3e%3cdefs%3e%3cclipPath%20id='clip0_2772_12454'%3e%3crect%20width='20'%20height='20'%20fill='white'%20transform='translate(6%206)'/%3e%3c/clipPath%3e%3c/defs%3e%3c/svg%3e)


'%3e%3cpath%20d='M14.5615%2031.9046H25.9297C26.5036%2031.9046%2026.9697%2032.3701%2026.9697%2032.9437V35.7552L26.9639%2035.8616C26.9104%2036.3852%2026.4676%2036.7933%2025.9297%2036.7933H25.8037C25.1902%2036.7934%2024.6569%2037.0835%2024.1855%2037.4368C23.9487%2037.6144%2023.7206%2037.8125%2023.5029%2038.0062C23.2832%2038.2016%2023.0755%2038.3909%2022.8682%2038.5589C22.5182%2038.8424%2022.0724%2039.012%2021.5869%2039.012H18.8779C18.3922%2039.012%2017.9456%2038.8424%2017.5957%2038.5589C17.3883%2038.3909%2017.1806%2038.2016%2016.9609%2038.0062C16.7434%2037.8126%2016.516%2037.6143%2016.2793%2037.4368C15.8668%2037.1275%2015.4065%2036.8672%2014.8867%2036.8069L14.6611%2036.7933H14.5615C13.9879%2036.7931%2013.5235%2036.3288%2013.5234%2035.7552V32.9437C13.5235%2032.3701%2013.9878%2031.9047%2014.5615%2031.9046ZM20.3848%200.98761C27.847%200.98761%2033.8963%207.03716%2033.8965%2014.4993C33.8965%2018.4346%2032.2143%2021.9769%2029.5293%2024.4466C28.2431%2025.6297%2027.258%2027.2224%2027.2578%2029.014V29.015C27.2575%2029.5885%2026.7914%2030.054%2026.2178%2030.054H14.5586C13.985%2030.054%2013.5188%2029.5885%2013.5186%2029.015V29.014C13.5183%2027.2247%2012.5334%2025.6349%2011.248%2024.4544C8.55856%2021.9844%206.87305%2018.4383%206.87305%2014.4993C6.8732%207.03726%2012.9227%200.987767%2020.3848%200.98761ZM20.0518%2018.6585C19.6614%2018.6587%2019.3447%2018.976%2019.3447%2019.3665V26.6859C19.345%2027.0761%2019.6615%2027.3927%2020.0518%2027.3929H20.7178C21.1082%2027.3929%2021.4245%2027.0762%2021.4248%2026.6859V19.3665C21.4248%2018.9759%2021.1084%2018.6585%2020.7178%2018.6585H20.0518Z'%20fill='url(%23paint0_linear_166_518)'%20stroke='url(%23paint1_linear_166_518)'%20stroke-width='0.416667'/%3e%3c/g%3e%3cdefs%3e%3clinearGradient%20id='paint0_linear_166_518'%20x1='20.3849'%20y1='0.779602'%20x2='20.3849'%20y2='39.2204'%20gradientUnits='userSpaceOnUse'%3e%3cstop%20offset='0.1'%20stop-color='%235549C2'/%3e%3cstop%20offset='0.9'%20stop-color='%2370C9E4'/%3e%3c/linearGradient%3e%3clinearGradient%20id='paint1_linear_166_518'%20x1='20.3849'%20y1='0.779602'%20x2='20.3849'%20y2='39.2204'%20gradientUnits='userSpaceOnUse'%3e%3cstop%20stop-color='%234D3DDD'/%3e%3cstop%20offset='0.322115'%20stop-color='%2364CDED'/%3e%3cstop%20offset='0.5'%20stop-color='%23736CFF'/%3e%3cstop%20offset='0.75'%20stop-color='%2364CDED'/%3e%3cstop%20offset='1'%20stop-color='%234D3DDD'/%3e%3c/linearGradient%3e%3cclipPath%20id='clip0_166_518'%3e%3crect%20width='40'%20height='40'%20fill='white'/%3e%3c/clipPath%3e%3c/defs%3e%3c/svg%3e)


'%3e%3cpath%20d='M31.01%204.32568C29.1716%207.09907%2027.894%209.22748%2027.1194%2010.8218C26.607%2011.8752%2026.3824%2012.5664%2026.2971%2013.019C26.2127%2013.467%2026.2606%2013.7057%2026.3293%2013.8325V13.8335L26.3323%2013.8384C26.3498%2013.8686%2026.3918%2013.9371%2026.4934%2013.9897C26.5848%2014.0371%2026.7072%2014.0629%2026.8733%2014.063C27.2288%2014.063%2027.6883%2013.9506%2028.2385%2013.7456C28.7927%2013.5391%2029.4565%2013.2322%2030.2258%2012.8267C31.7308%2012.0333%2033.655%2010.8562%2035.9875%209.3042L36.3762%209.79346C34.0139%2012.0094%2032.1768%2013.8719%2030.9241%2015.5464C29.6466%2017.2539%2028.9592%2018.7892%2028.9592%2020.3247V20.5327H28.9709C29.0302%2021.999%2029.7102%2023.4718%2030.9299%2025.1021C32.1828%2026.7767%2034.0204%2028.6388%2036.3831%2030.855L35.9924%2031.3442C33.66%2029.7923%2031.7356%2028.6151%2030.2307%2027.8218C29.4616%2027.4163%2028.7984%2027.1093%2028.2444%2026.9028C27.6942%2026.6978%2027.2346%2026.5854%2026.8792%2026.5854C26.7132%2026.5855%2026.5907%2026.6114%2026.4993%2026.6587C26.3975%2026.7114%2026.3556%2026.7809%2026.3381%2026.811L26.3352%2026.8149C26.2662%2026.9414%2026.2184%2027.179%2026.303%2027.6274C26.3883%2028.0793%2026.6129%2028.7705%2027.1252%2029.8267C27.8998%2031.4207%2029.1724%2033.5483%2031.0159%2036.3218L30.5256%2036.7114C28.3119%2034.3499%2026.4515%2032.5118%2024.7776%2031.2583C23.0705%2029.98%2021.5349%2029.2915%2019.9983%2029.2915C18.4617%2029.2915%2016.9261%2029.98%2015.219%2031.2583C13.545%2032.5119%2011.6839%2034.3496%209.46997%2036.7114L8.97974%2036.3218C10.818%2033.5485%2012.0967%2031.4209%2012.8713%2029.8267C13.3835%2028.7736%2013.6082%2028.083%2013.6936%2027.6304C13.7782%2027.1812%2013.7304%2026.9415%2013.6614%2026.8149L13.6584%2026.811L13.6096%2026.7437C13.5843%2026.716%2013.5483%2026.6851%2013.4973%2026.6587C13.4059%2026.6114%2013.2834%2026.5855%2013.1174%2026.5854C12.7619%2026.5854%2012.303%2026.6978%2011.7532%2026.9028C11.1995%2027.1093%2010.5367%2027.4163%209.76782%2027.8218C8.26358%2028.6151%206.33836%2029.7912%204.00317%2031.3433L3.61841%2030.855C5.98121%2028.6386%207.81958%2026.7767%209.07251%2025.1021C10.3498%2023.3947%2011.0372%2021.86%2011.0374%2020.3247C11.0374%2018.7892%2010.35%2017.2539%209.07251%2015.5464C7.81948%2013.8716%205.9815%2012.0091%203.61841%209.79248L4.00317%209.3042C6.33861%2010.8564%208.26347%2012.0333%209.76782%2012.8267C10.5367%2013.2322%2011.1995%2013.5391%2011.7532%2013.7456C12.303%2013.9506%2012.7619%2014.063%2013.1174%2014.063C13.2835%2014.063%2013.4059%2014.037%2013.4973%2013.9897C13.5988%2013.9372%2013.6409%2013.8687%2013.6584%2013.8384L13.6614%2013.8335C13.7304%2013.707%2013.7783%2013.4696%2013.6936%2013.021C13.6083%2012.5691%2013.3837%2011.8779%2012.8713%2010.8218H12.8704C12.0956%209.22166%2010.8232%207.09888%208.97974%204.32568L9.46997%203.93701C11.6838%206.29874%2013.5434%208.13651%2015.2161%209.39014C16.9217%2010.6684%2018.4559%2011.3578%2019.9924%2011.3579C21.529%2011.3579%2023.0646%2010.6685%2024.7717%209.39014C26.4457%208.13661%2028.3061%206.29858%2030.5198%203.93701L31.01%204.32568Z'%20fill='url(%23paint0_linear_166_603)'%20stroke='url(%23paint1_linear_166_603)'%20stroke-width='0.416667'/%3e%3c/g%3e%3cdefs%3e%3clinearGradient%20id='paint0_linear_166_603'%20x1='20.001'%20y1='3.65479'%20x2='20.001'%20y2='36.9939'%20gradientUnits='userSpaceOnUse'%3e%3cstop%20offset='0.1'%20stop-color='%235549C2'/%3e%3cstop%20offset='0.9'%20stop-color='%2370C9E4'/%3e%3c/linearGradient%3e%3clinearGradient%20id='paint1_linear_166_603'%20x1='20.001'%20y1='3.65479'%20x2='20.001'%20y2='36.9939'%20gradientUnits='userSpaceOnUse'%3e%3cstop%20stop-color='%234D3DDD'/%3e%3cstop%20offset='0.322115'%20stop-color='%2364CDED'/%3e%3cstop%20offset='0.5'%20stop-color='%23736CFF'/%3e%3cstop%20offset='0.75'%20stop-color='%2364CDED'/%3e%3cstop%20offset='1'%20stop-color='%234D3DDD'/%3e%3c/linearGradient%3e%3cclipPath%20id='clip0_166_603'%3e%3crect%20width='33.3333'%20height='33.3333'%20fill='white'%20transform='translate(3.33167%203.65479)'/%3e%3c/clipPath%3e%3c/defs%3e%3c/svg%3e)

'%20fill='white'/%3e%3cpath%20d='M7.19995%2021.6808C7.19995%2020.3553%208.27447%2019.2808%209.59995%2019.2808H38.3999C39.7254%2019.2808%2040.7999%2020.3553%2040.7999%2021.6808V36.0808C40.7999%2037.4062%2039.7254%2038.4808%2038.4%2038.4808H9.59995C8.27447%2038.4808%207.19995%2037.4062%207.19995%2036.0808V21.6808Z'%20fill='%230A328F'/%3e%3cpath%20d='M22.4787%2029.5558L12.0292%2023.407C11.4796%2023.0835%2011.1421%2022.4934%2011.1421%2021.8556V13.8165C11.1421%2012.491%2012.2166%2011.4165%2013.5421%2011.4165H34.4584C35.7838%2011.4165%2036.8584%2012.491%2036.8584%2013.8165V21.8556C36.8584%2022.4934%2036.5209%2023.0835%2035.9712%2023.407L25.5216%2029.5558C24.5826%2030.1084%2023.4178%2030.1084%2022.4787%2029.5558Z'%20fill='%2340D1F1'/%3e%3cpath%20d='M16.8351%2016.5635L31.1649%2016.5635'%20stroke='%230A328F'%20stroke-width='2.4'%20stroke-linecap='round'%20stroke-linejoin='round'/%3e%3cpath%20d='M16.8351%2021.2124L24%2021.1465'%20stroke='%230A328F'%20stroke-width='2.4'%20stroke-linecap='round'%20stroke-linejoin='round'/%3e%3c/svg%3e)


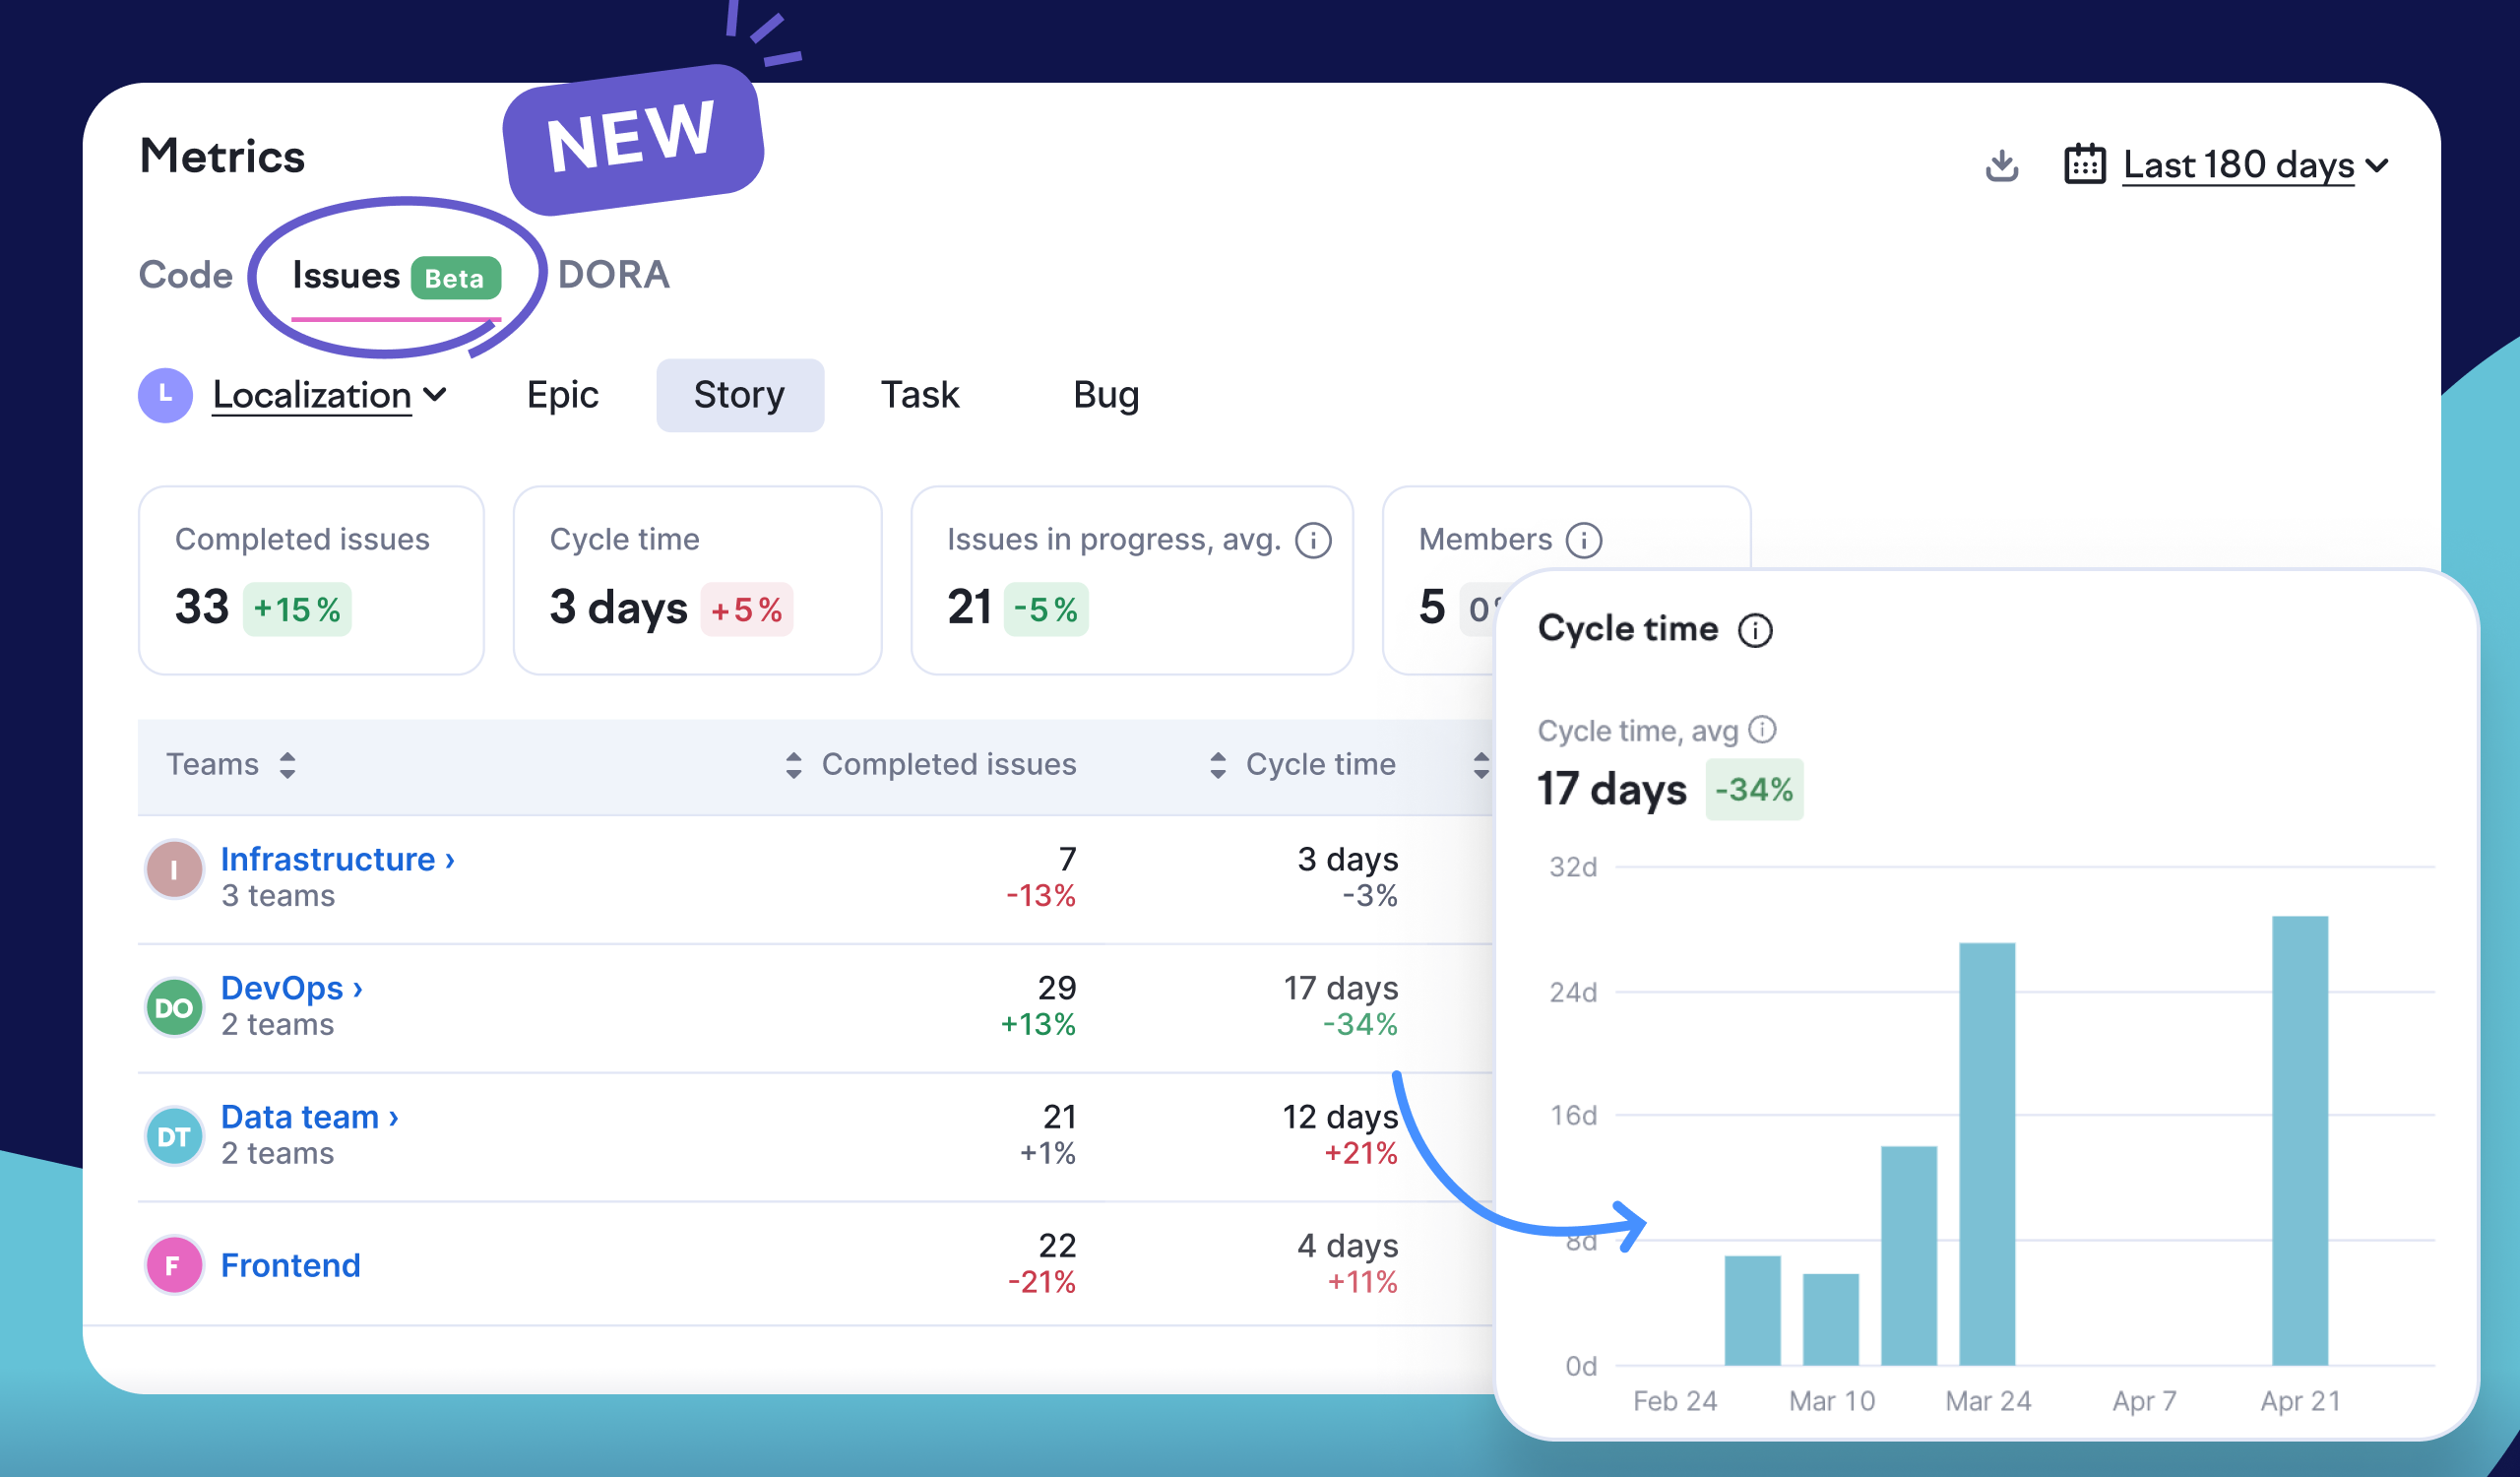
See sprint metrics across all your teams
Until now, Swarmia’s sprint metrics showed one team at a time. To get the bigger picture across a group of teams, you had to open each sprint and piece it together yourself. The new sprints overview does that for you. Select your organization or a parent team, and Swarmia aggregates the sprint…
Read more→