Understanding whether your team’s performance is on track can be tricky. Are your pull request cycle times good enough? Should you be concerned about your change failure rate? Which teams might need extra support?
You can now compare your engineering metrics against Swarmia benchmarks and your team against the organization average. This makes it easier to spot improvement areas and identify which teams are doing well.
When viewing metrics in Swarmia, click the previous period button above the table to select from three options:
- Previous period (default): See how metrics have changed over time.
- Organization: Compare individual teams against your organization’s baseline.
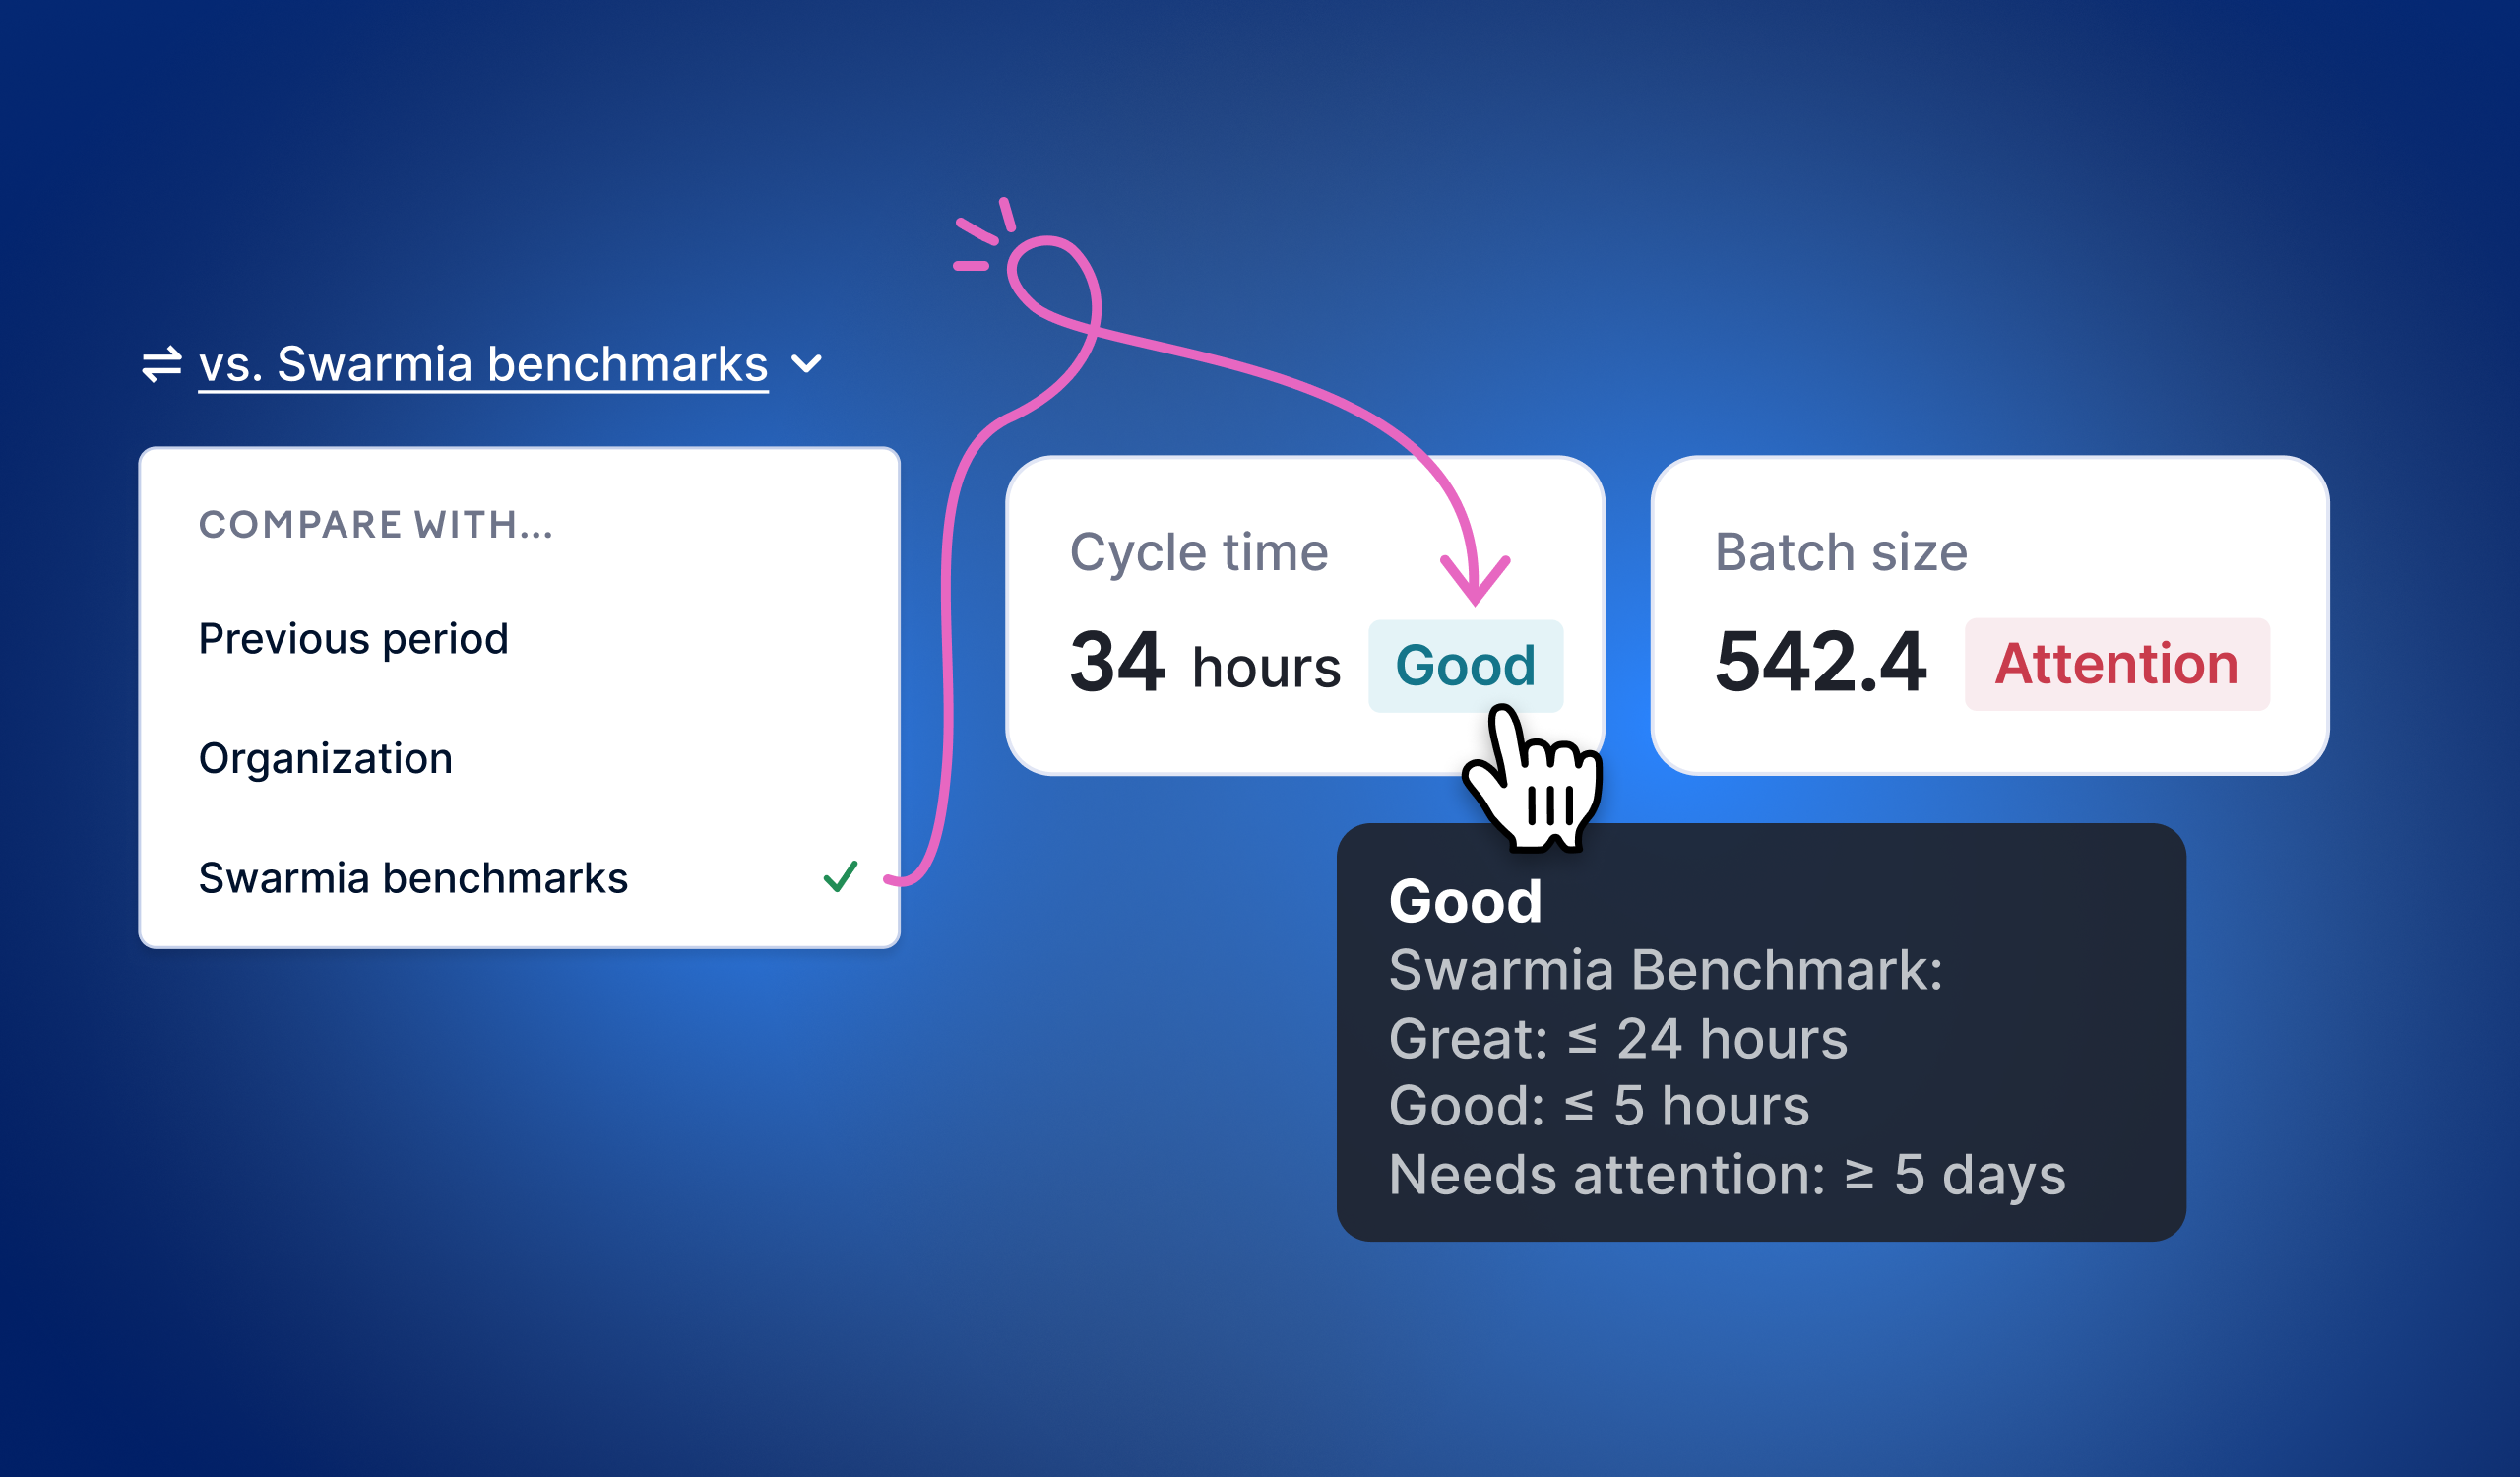
- Swarmia benchmark: See how you stack up against industry standards.
For previous period and organization comparisons, you’ll see the difference displayed next to each metric. When using Swarmia benchmarks, you’ll see a color-coded label — great, good, or attention — showing how your performance compares to proven benchmarks.
Benchmarks are available for code metrics (pull request cycle time and batch size) and DORA metrics. Organization comparisons work across code, DORA, and issue metrics.
The comparisons help you quickly answer questions like “Which aspects of our delivery are we doing well, and where can we improve?” or “Which teams might need additional support?”
For example, if your change failure rate shows “attention” while your lead time is “great,” you know exactly where to focus your improvement efforts. Or if one team’s cycle time is significantly above your organization’s average, you can investigate what’s slowing them down.
To get started, navigate to the metrics views in Swarmia, click previous period above the table, and select either organization or Swarmia benchmark.