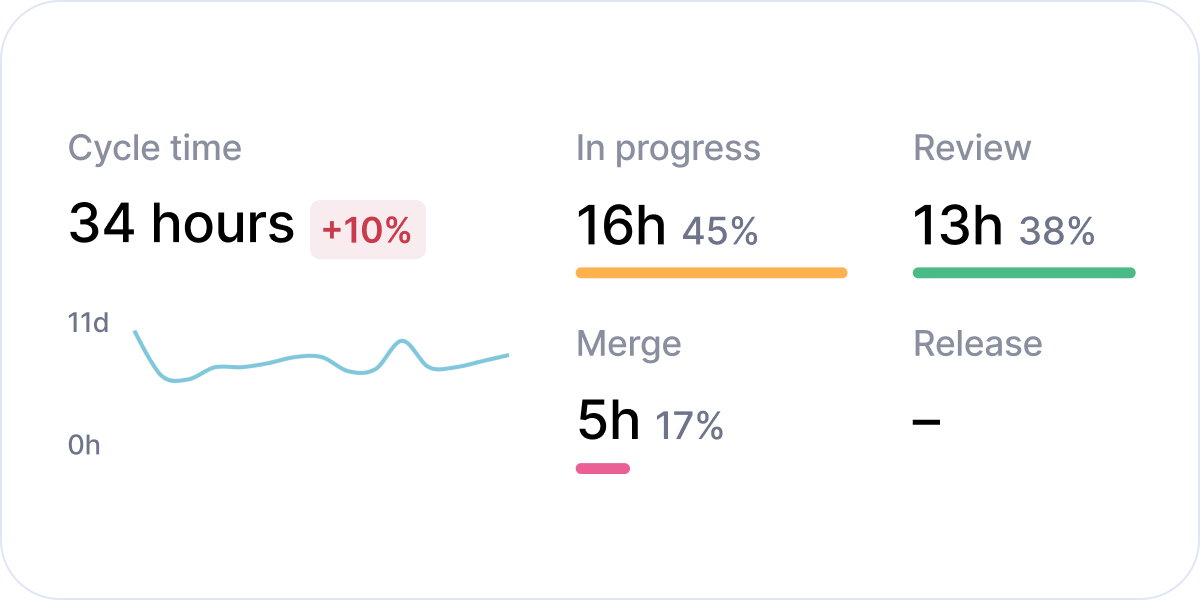
Pull request cycle time trendline and breakdown by stage
A software team’s velocity is a combination of many factors. Looking into pull request pipeline by stage is a great starting point to identify bottlenecks and get pull requests through faster. With the new cycle time breakdown it is easy to see whether review, merge, or WIP time takes longer than expected.
You can also use Swarmia’s filters to look at cycle time and throughput metrics for bot-created, cross-team, and other PRs separately.
The chart below cycle time shows how your pull request queue trends over time. When multiple pull requests are left open for long, it trends up. When pull requests are merged timely, it trends down. Many teams will notice that Christmas bump on longer timeframes where cycle time increases during holiday time 🎅.
Pull request age now includes the time since the first commit
Previously, pull request age was calculated from the moment a pull request was created, and earlier commits would not get reflected in cycle time insights. Including time since the first commit allows better comparison between pull requests and makes pull request insights more accurate.
Other improvements
Throughput (pull requests merged per day) chart got updated, and now includes the total number of pull requests merged in the selected timeframe in addition to the daily average.
Cycle time and throughput metrics now include a comparison to the previous time period
Subscribe to our newsletter
Get the latest product updates and #goodreads delivered to your inbox once a month.