Getting high-quality data about your pull request pipeline is the first step to a better understanding of process changes that improve velocity and quality. Our new pull request insights are here to help. See some key highlights below.
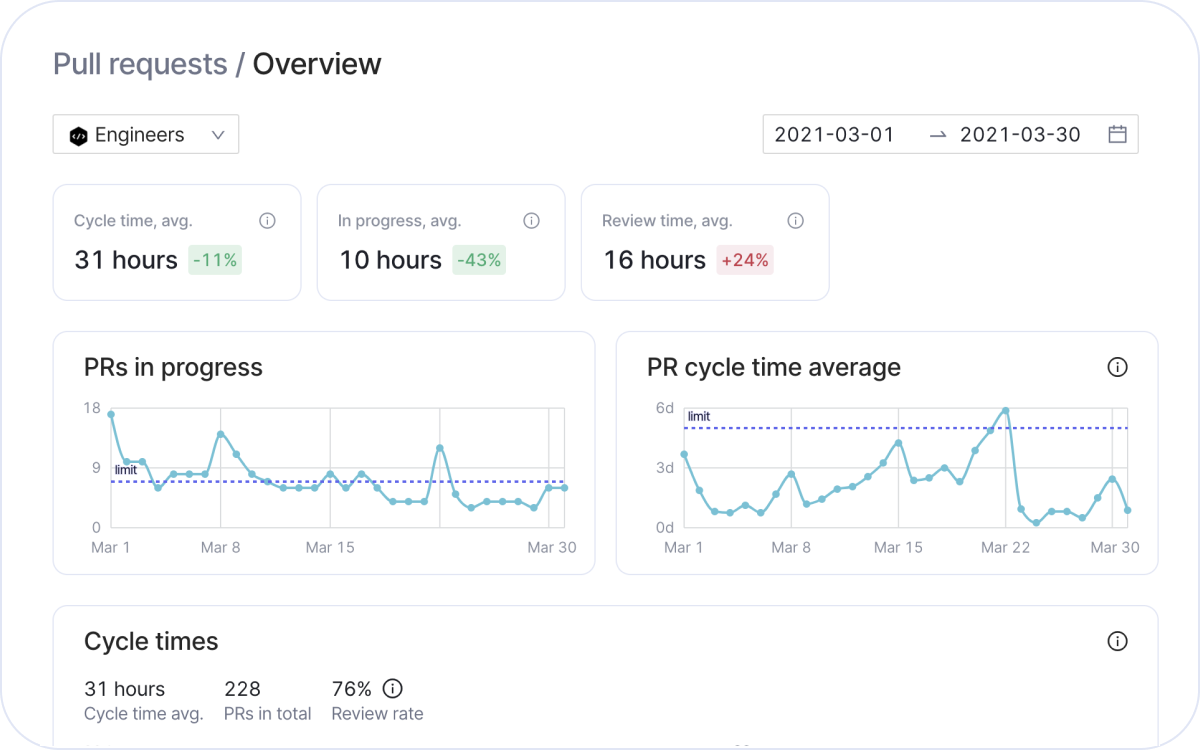
Cycle time average graph (on the right) shows how long it generally takes you to close pull requests, and how the situation develops over time. If you close pull requests timely, it trends down. Pull requests left open for several days result in an upwards trend. Aiming to close all pull requests in under a week (or 1–2 days on average) is a good starting point for uninterrupted delivery.
Pull requests in progress graph (on the left) gives a clue into how your ability to close pull requests is affected by the number of pull requests worked on at once by the team. Working on too many pull requests at once can result in longer delivery times, and we recommend adding a work in progress limit (e.g. up to 7 pull requests open at once) to make sure pull requests piling up don't slow down the team.
➡️ Cycle time distribution chart (on the right) shows what portion of pull requests takes longer than expected to complete, and individual pull requests are shown in the scatter plot on the left. Pull requests far above the rolling average line need special attention — it’s the code that’s been waiting for the longest to be delivered.
Filter the pull request table by status, repository, or author (by clicking the filter icon in the table header) to identify problematic pull requests. Filters apply to the table as well as the charts above.
Review time is another important contributing factor to cycle time. Sorting the table by review time helps to identify pull requests that have spent the longest in review — or have been merged without review at all. The number of pull requests merged without review is reflected in the review rate above the charts.
Other improvements
Tasks completed with no coding activity are now shown at the bottom of work log making it easier to see where the engineering team’s focus has been week to week.
Subscribe to our newsletter
Get the latest product updates and #goodreads delivered to your inbox once a month.