Our goal is to bring transparency and insight into the entire product development process and empower software teams to own their ways of working. When we introduce high-level metrics like cycle time of pull requests and issues, our primary focus is on data quality (see more in our help center). We break high-level metrics into contributing factors allowing teams to investigate their development workflow in greater detail — ultimately, it's all about making insights clear and actionable.
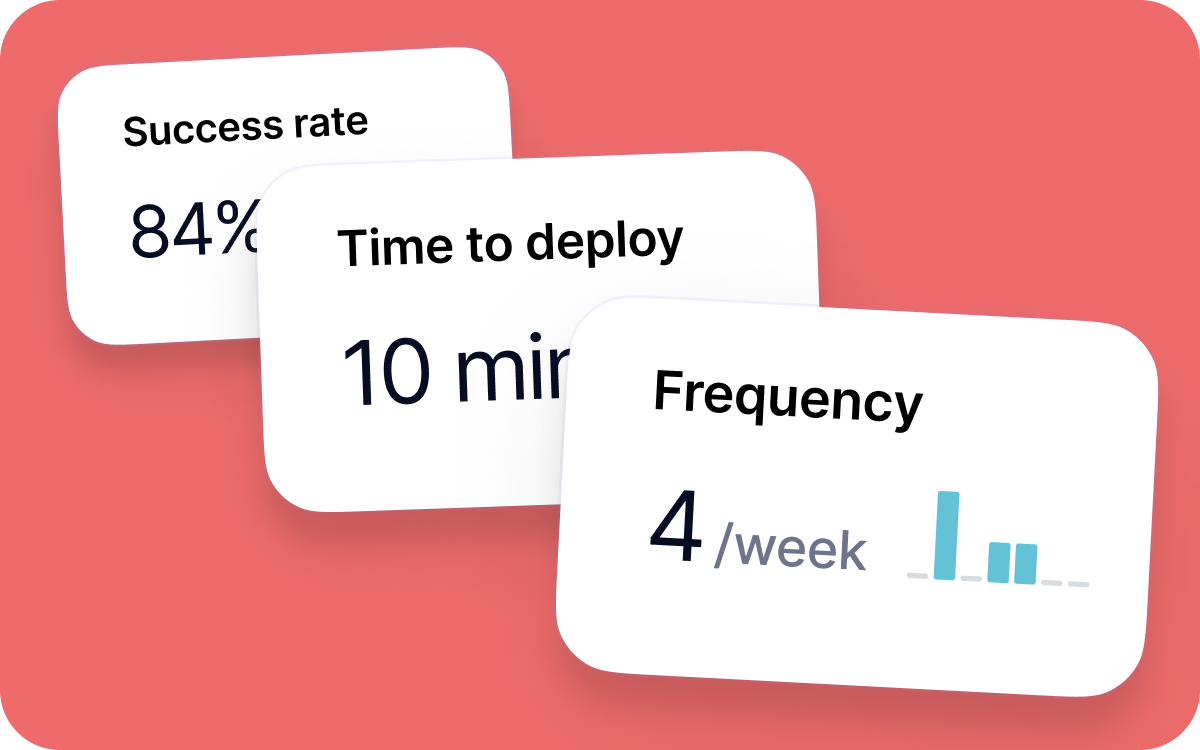
Swarmia’s holistic approach has gotten even more complete with the addition of deployment insights. Now you can see deployment frequency, average deploy time, and deploy success rate in Swarmia.
We use GitHub’s check runs to analyze deployment data. Enable deployment insights by selecting relevant check runs in repository settings in Swarmia.
Performance improvements
We’ve improved the performance of all charts and tables. Now it’s easy to load up to a year’s worth of data on a team's performance — helping to spot trends and outliers that aren’t as clear on shorter timeframes.
More clarity for issue cycle time calculation
You can now see the exact time intervals included in cycle time calculations for all issues: just hover over the time an issue was in progress anywhere in the app.
If an issue was in progress more than once (it happens if it was moved to in progress by accident, or returned to backlog half-done), only relevant time intervals are counted towards the cycle time.
Subscribe to our newsletter
Get the latest product updates and #goodreads delivered to your inbox once a month.