The problem with story points

If you’ve sat through estimation meetings, debated whether a task is a 3 or a 5, and then watched those numbers get used in ways that felt counterproductive, you’re not alone.
Story points were created with good intentions — to provide an abstract measure of effort without committing to specific timelines. But they’ve become a source of friction in most engineering organizations.
Across Reddit, Stack Overflow, and Atlassian’s community forums, developers and engineering leaders squabble (and have done so for over a decade) over the same issues: velocity becomes a weapon for comparison, teams game the system to protect themselves, and the numbers never answer the questions stakeholders actually care about.
Here’s where they break down, and how to get the answers you actually need.
Where story points break down
Story points were meant to help teams split work and ship value. But they’ve evolved into something else entirely.
- They lead to miscommunication. One person thinks story points mean complexity, effort and risk; another might think they map to hours. Everyone’s speaking a different language using the same numbers.
- They become comparison tools. Leadership misuses velocity to compare teams or individuals, creating a culture where developers inflate estimates just to protect their perceived output. I’ve seen teams spend more time defending their estimates than delivering value.
- They hide what matters. A story point conflates time, complexity, and risk into one number. Is a story an “8″ because it’s time-consuming but simple, or because it’s quick but architecturally risky? You can’t tell from the number alone, and that ambiguity leads to misaligned expectations.
- They create false precision. Story points suggest you can know enough to plan work with precision, when in reality software development is a matter of constant learning, iteration, and collaboration with customers. This level of ‘precision’ is an illusion that often sets everyone up for disappointment.
The core problem is that story points don’t answer the questions (often non-technical) business partners need answered.
What you actually need to know
Story points can be useful training wheels for inexperienced teams learning to split work and ship incrementally. But they shouldn’t be the end state of a healthy team. Most teams using story points are really trying to answer a few critical questions.
I’ll get into those, and what actually helps answer them, next.
How productive is my team?
Velocity (story points completed per sprint) tells you almost nothing about actual productivity. A team could double their velocity by inflating estimates, which doesn’t benefit anyone.
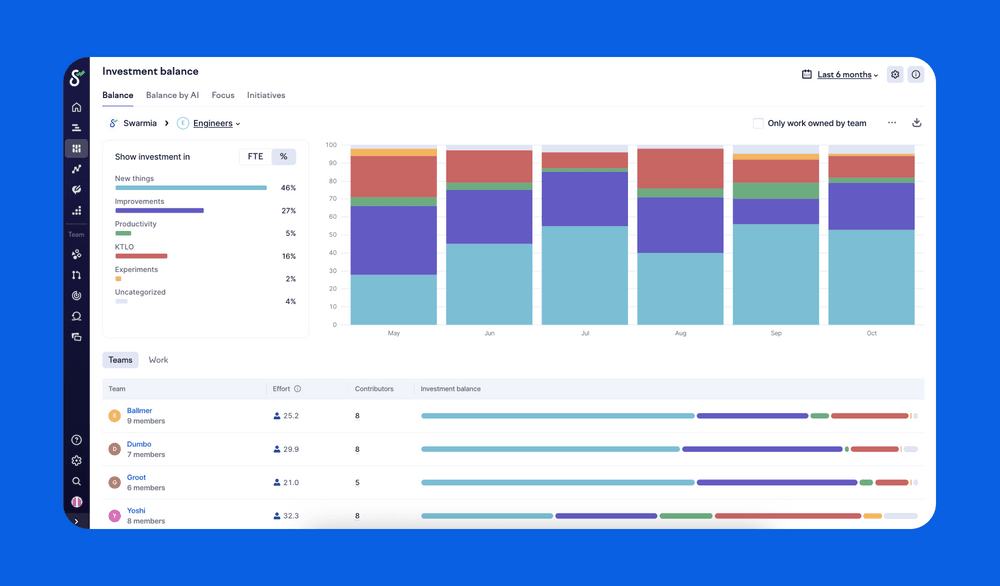
What actually helps is measuring where the effort is going. Swarmia’s FTE model analyzes developer activity across pull requests, commits, and code reviews to show how time is spent. This gives you objective data about engineering effort without the politics of estimation.
Combine this with investment balance, and you can see that 60% of effort is going to new features and 40% to tech debt. That’s real life insight into whether your team is working on what matters most to the business.
When will this be done?
Guessing based on velocity is notoriously unreliable. I’ve watched countless roadmap presentations where leaders confidently projected completion dates based on story point velocity, only to miss by months (and in some instances, over a year).
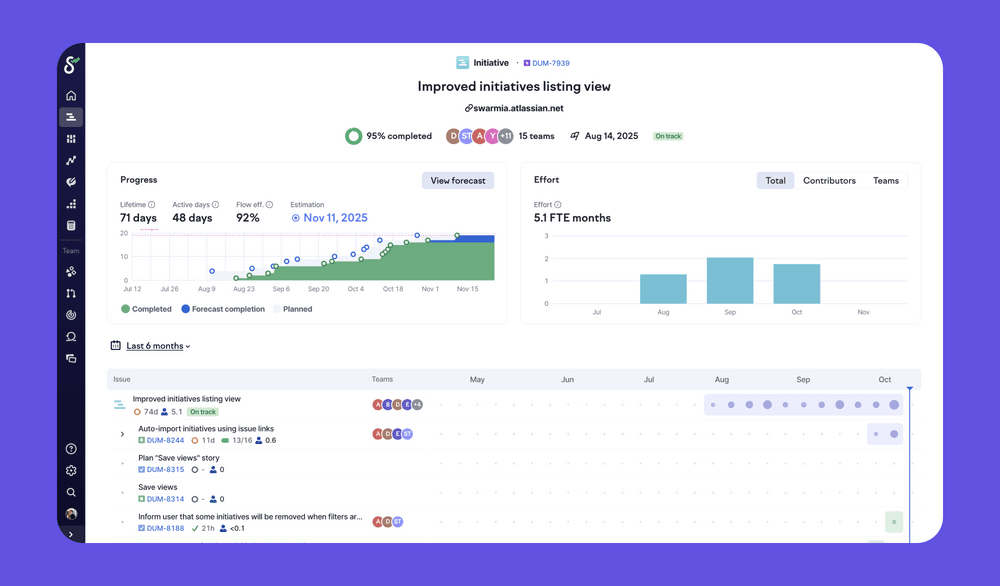
What actually helps is to work off historical cycle time. Measure the actual time spent on work that moves from “In progress” to “Done”. This should give you predictable delivery patterns based on what actually happened, not what you hoped would happen.
For larger projects, you can use historical throughput and cycle time data to forecast when work will be completed. You can even model different scenarios to see how changes in scope or team allocation affect the timeline, turning “When will it be done?” from a guess into a statistical probability.
This approach recognizes what story points miss: software development isn’t about knowing everything upfront. It’s about learning, iterating, and adapting as you go. Forecasts based on historical data account for this reality in a way that estimates never can.
How much can we get done in a period of time?
This is one of the more defensible uses of story points — teams use them to understand their capacity and plan accordingly. But the predictability story points promise often falls apart in practice.
The thing is, estimation and predictability aren’t the same. Predictability comes from creating a consistent, observable flow of work, not from getting better at guessing. Software development is inherently uncertain, and trying to assign a single number to a complex task creates a false sense of precision.
I like to think of a large project like a hurricane forming at sea. In the early stages, forecasters can only make educated guesses about its path, strength, and eventual landfall. There are too many variables and too much uncertainty. As the hurricane gets closer to land, the forecast becomes much more accurate and reliable.
Software work follows quite the same pattern. Predictability comes from creating a system to track progress as work moves closer to completion, allowing you to adapt and forecast with increasing accuracy.
Moving from unpredictable storms to a predictable steady flow
The key is to break the giant, unpredictable hurricane into a series of smaller, more predictable weather patterns. By managing work in different sizes, you can align your planning horizon with the level of uncertainty.
A typical hierarchy for sizing work might look like this (though the exact names will vary depending on whether you use Jira, Linear, or another tool):
- Themes (years): The hurricane is just forming. We know it’s out there, but its impact is highly uncertain.
- Initiatives (quarters): The storm has a general direction. We have a cone of uncertainty, but the path is becoming clearer.
- Epics (weeks to months): The hurricane is a few days from landfall. We have a good idea of the affected area.
- Stories (days): The storm is just offshore. We can predict its landing with high accuracy.
- Sub-tasks (hours): The rain has started. We know exactly what’s happening now.
Even with the best-laid plans, a random front can come in — an unknown dependency, hidden tech debt, or unclear scope — that changes the course. This is fine, and exactly why measuring the actual flow of work is more valuable than relying on upfront estimates.
How work cycle time creates predictability
So how do you actually create this predictable flow? It starts with measuring what’s happening at the level most teams care about: work cycle time — the actual time it takes for a work item (a story, task, or issue) to move from “In progress” to “Done.”
This is the metric that answers “how long does it take to finish the things we commit to?” When your work cycle time is consistent — say, most stories complete within 2-3 days — you can forecast with statistical confidence when an epic composed of 10 stories will be done. You’re no longer guessing based on story points; you’re forecasting based on real, historical data about how your team actually delivers work.
Your work cycle time is directly influenced by what happens at the code level. Stories get done through pull requests, so when pull requests move slowly, stories move slowly. When pull requests move fast, stories move fast.
The connection to pull request cycle time
When you break work into smaller stories, you naturally create smaller, more focused PRs. And smaller PRs move through your development system faster:
- Faster, easier reviews: Small PRs are quicker for teammates to review, reducing idle time.
- Lower risk of merge conflicts: Less code changing at once means less time spent resolving conflicts.
- Quicker deployments: Small changes can be deployed more rapidly and with greater confidence.
When your PRs move quickly through coding, review, and deployment, your stories spend less total time “In progress.” This creates a shorter, more predictable work cycle time. And because you’re working in small batches, you get continuous feedback that allows you to adapt when unexpected complexity emerges — like that random front that changes the hurricane’s path.
The entire system reinforces itself: smaller work items lead to smaller PRs, smaller PRs move faster, faster PRs mean more predictable story completion, and predictable stories mean you can forecast larger initiatives with confidence.
How can we do more with less?
Pushing for “more story points” usually leads to burnout without delivering more value. It treats symptoms, not causes.
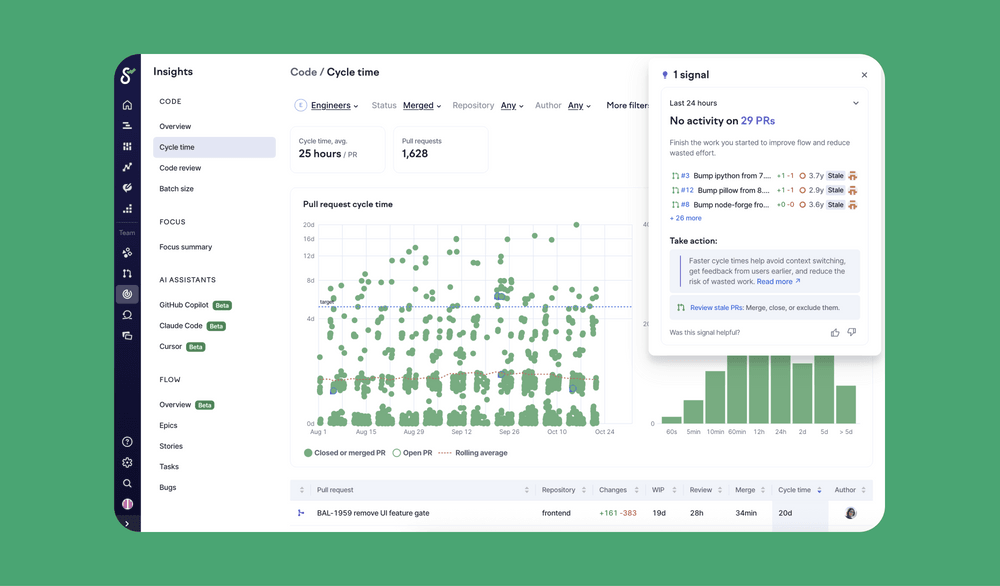
What actually helps is identifying your bottlenecks. Breaking down PR cycle time into its phases (coding, review, idle, deployment) shows exactly where work gets stuck. Is it long review times? Work sitting idle waiting for deployment? These insights point to specific improvements you can make.
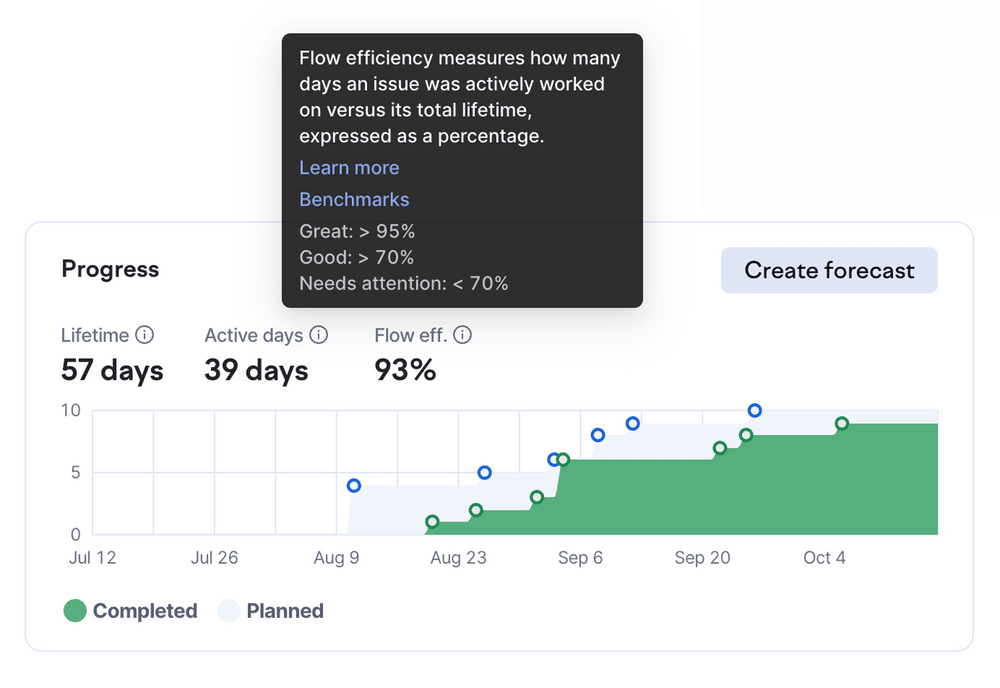
Tracking issue flow efficiency (the ratio of active work time to waiting time) directly translates to better performance. By focusing on improving the system of work rather than just pushing individuals, you get sustainable gains.
Understanding these numbers helps you have better conversations. Instead of “Why did we only complete 23 story points?” you’re asking “Why is our review time increasing?” or “What’s causing work to sit idle before deployment?”
These questions lead to actionable improvements: clearer ownership, better tooling, or process changes that actually move the needle.
How do I track time for finance reporting?
Many teams use story points as a proxy for time tracking because finance needs to know how much effort went into capitalizable work. The problem is that story points were never designed to track time, which is exactly what makes them unreliable for this purpose.
What actually works for software capitalization is tracking actual developer activity. Tools like Swarmia measure effort based on real work (e.g. commits, pull requests, code reviews) and translate that into FTE allocations. This gives finance teams the time-based data they need while eliminating the overhead of manual timesheets or trying to convert story points into hours.
You get accurate reports about capitalizable versus non-capitalizable work without adding estimation overhead to your engineering teams. The data is real-time, auditable, and captures the actual work that happened, not what someone guessed would happen weeks earlier.
Making the transition
Change is hard, and moving away from story points takes time and intentional effort. The approach that works best is to run both systems in parallel for a few weeks. Keep estimating with story points while you start tracking cycle time and effort distribution. Compare what story points predicted versus what actually happened.
Run retrospectives that look at both sets of data. When teams see that cycle time data answers their questions more clearly than velocity ever did, the transition will be much easier. Start using historical data for forecasting. Make story points optional for new work. Focus your improvement conversations on cycle time and flow efficiency.
The key is building confidence in the new approach before fully letting go of the old one.
Focus on flow, not estimates
The goal of agile was never to get good at estimating. It was to deliver value, respond to change, and continuously improve. Story points, as they’re commonly used, distract from these principles.
By measuring what actually happens — where effort goes, how long work takes, where bottlenecks occur — you can have more meaningful conversations about what truly matters: Are we working on the right things? How can we deliver value faster? Where are the systemic issues holding us back?
The evidence is clear, both from analysis and widespread frustration in engineering communities: story points have outlived their usefulness. It’s about time we measure what actually brings us results.

Subscribe to our newsletter
Get the latest product updates and #goodreads delivered to your inbox once a month.
More content from Swarmia

