Complete DORA metrics: calculate MTTR and change failure rate based on your deployment data
When it comes to understanding software delivery performance, the framework introduced by the DORA team in the 2018 book Accelerate is the best-known one among engineering leaders.
Earlier this year, we published our guide to DORA metrics to help you understand how to get the most value from them.
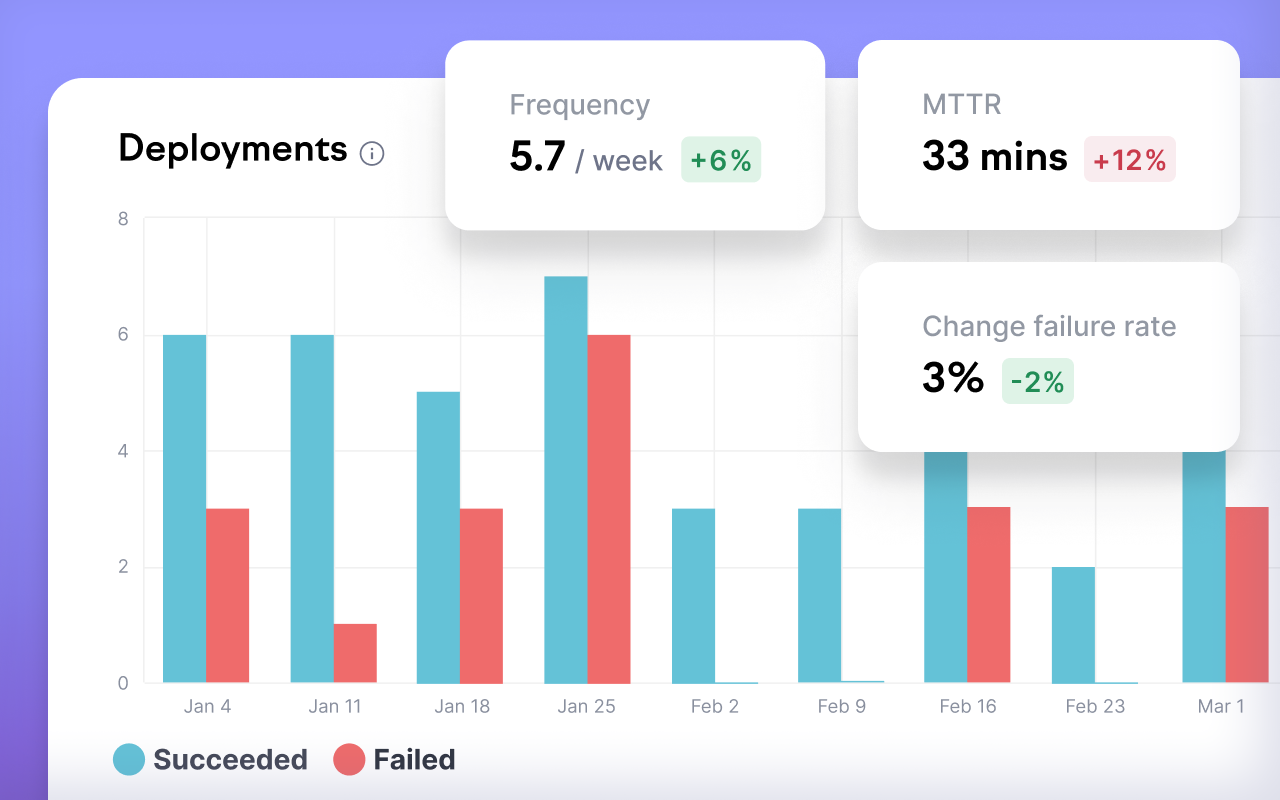
Swarmia already had extensive coverage of the software delivery insights around change lead time and deployment frequency. Now we've improved our deployments insights, adding MTTR (mean time to recovery) and change failure rate for complete coverage of DORA metrics.
In order to calculate these metrics with Swarmia, all you have to do is inform Swarmia about deployments of your app and fixes to previous deployments (fix data is used to calculate time to recovery). You can then filter deployment insights by app and environment in Swarmia.
Performance improvements: improved page loads for data-heavy views and faster Slack notifications
As we onboard more organizations to Swarmia, we want to make sure the app feels fast even as you load historical data for hundreds of contributors.
Our latest performance improvements significantly improve page load times, bringing almost 50x improvements on some queries.
Interacting with Swarmia's Slack notifications should now feel snappier as well.
More improvements
When you select a team anywhere in Swarmia, we now preserve your selection as you navigate in the app.
We improved the logic behind the “Avoid working alone” working agreement, making sure only the issues that belong to your team are included in the exceptions.
It's now easier to assign Jira issues to teams. When you filter issues by Team ID, we now show the team name behind the ID in the dropdown.
Subscribe to our newsletter
Get the latest product updates and #goodreads delivered to your inbox once a month.