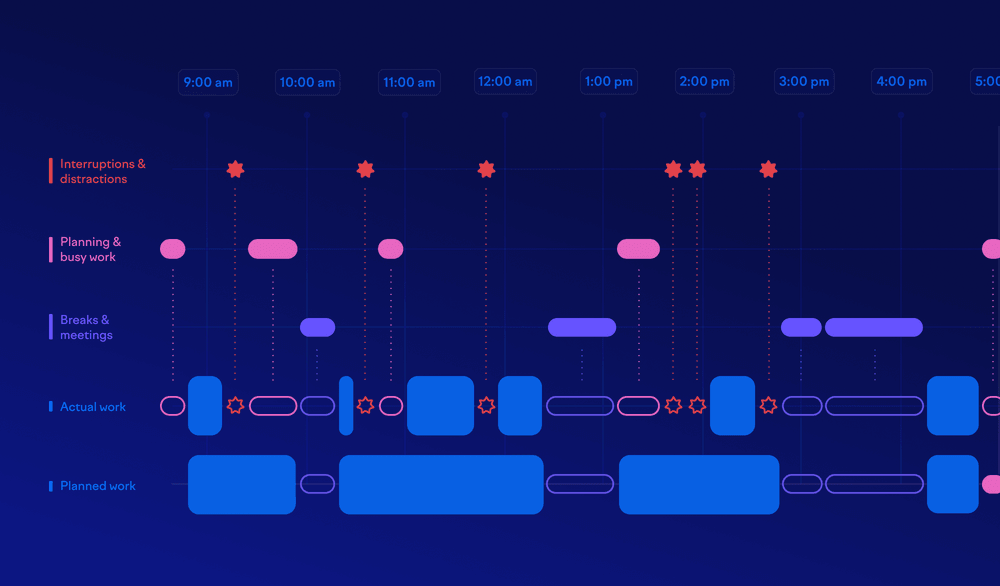
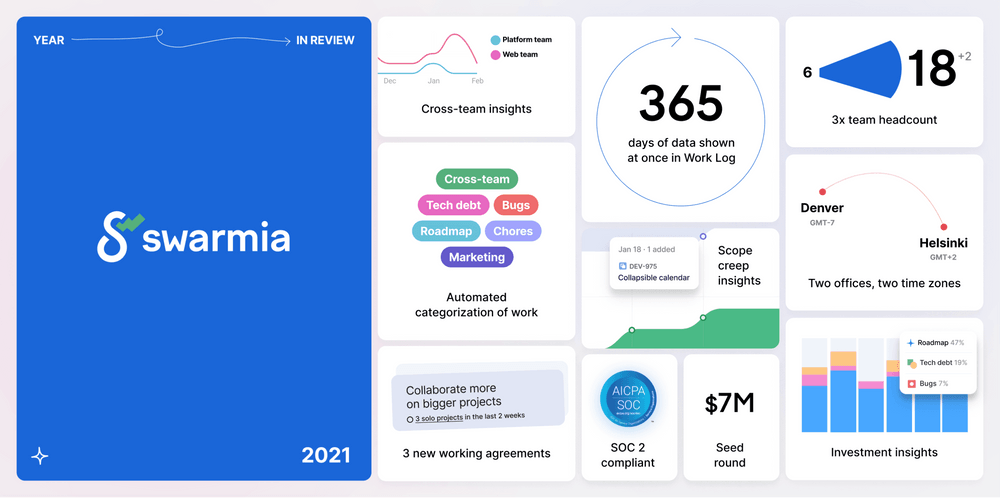
The software world gave up too soon on measuring development productivity, deeming it impossible. A few years ago a new wave of research arrived that proved otherwise. After discussing the foundations for this measurement approach, this article will share some practical tips for instrumenting a modern high-performance and continuously improving development organization.
Foundations for measuring software engineering
It's no wonder measuring software development productivity hasn't worked so far. The discussion easily gravitates toward measuring individual performance, dumbing it down to a single number, or getting the organization to game the metrics to receive recognition.
In the 2018 book Accelerate, Dr. Nicole Forsgren, Jez Humble, and Gene Kim took a scientific approach to finding measures that would lead to increased organizational performance. Forsgren has continued advancing the book’s ideas and recently published the SPACE framework as an approach for thinking about measurement holistically. Developed by Forsgren, Margaret-Anne Story and several Microsoft researchers, the SPACE framework considers:
- Satisfaction and well-being
- Performance
- Activity
- Communication and collaboration
- Efficiency and flow
The idea is quite simple: measuring developer productivity is easy to get wrong, but that's not a reason to close your eyes to the information. By taking a holistic approach, ranging from flow of work to quality metrics and surveying the developers, you gain understanding to accelerate the team's learning.
Another classic book that focuses mostly on the flow of work is the ground-breaking Principles of Product Development Flow by Donald G. Reinertsen. The key themes revolve around building an economic model for understanding software delivery, managing queues, reducing batch size and limiting Work In Progress.
Great organizations build feedback loops to support decision-making and move faster than the competition. It's up to you to evaluate what to measure in your own context.
Having built several high-performing product development organizations, I've ended up implementing something like the SPACE framework on several occasions. For me, it's easier to categorize the dimensions into three parts: Impact, Flow, and Health. Let’s first discuss what I mean by Impact.
Impact – are we driving business outcomes?
This is the most important question: what are we getting in exchange for the investment in product development? The answer should not be a list of features but rather your business and its key metrics moving in the right direction.
In practice, Impact metrics are often owned by Product Managers, and companies that do goal-setting with something like Objectives and Key Results (OKRs) use Impact metrics to align teams.
In a modern product development organization, agreeing on the objectives and outcomes is a way to empower the teams, as Marty Cagan and Chris Jones write in the 2020 book Empowered. Traditional organizations control team backlogs from the top at the feature level, while modern organizations empower teams to adjust their own backlogs as long as the team keeps business objectives in mind.
Feature adoption
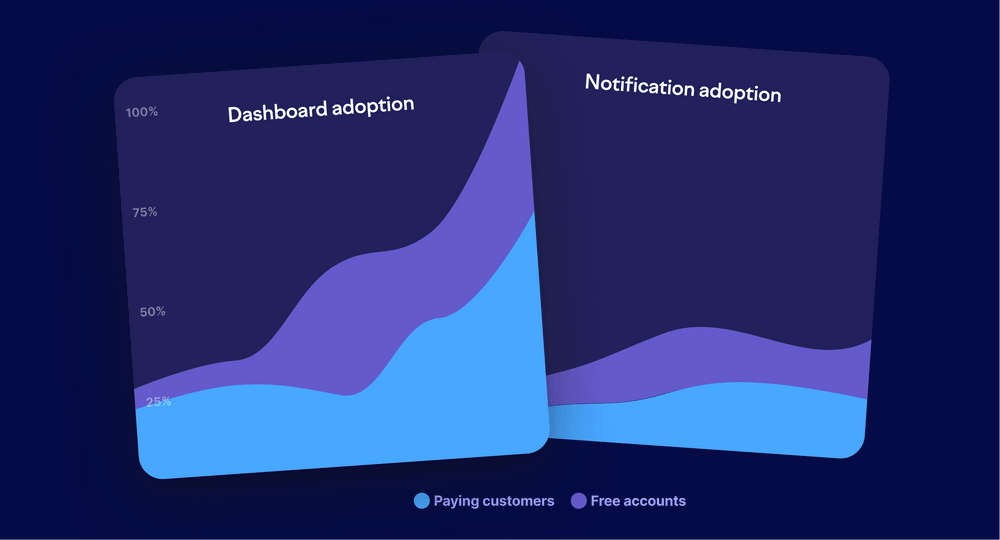
The starting point for most software products is to track feature adoption. You might use products like Amplitude, Pendo, or Heap to track the events or maybe something like Segment to relay events to your data warehouse.
You're going to appreciate a flexible solution since you don't know all your research questions upfront. For example in our business (of building SaaS tools for data-driven engineering management), we like to focus on metrics about onboarded teams rather than individuals, which would not be well-served by something like Google Analytics.
Feature adoption doesn't automatically guarantee growing revenues and profits. It's a reasonable assumption that people who use your product are likely to pay for it, but this assumption also deserves a critical look. Once you have this data, it’s easy to analyze how well different features correlate with successful onboarding.
Investment categories
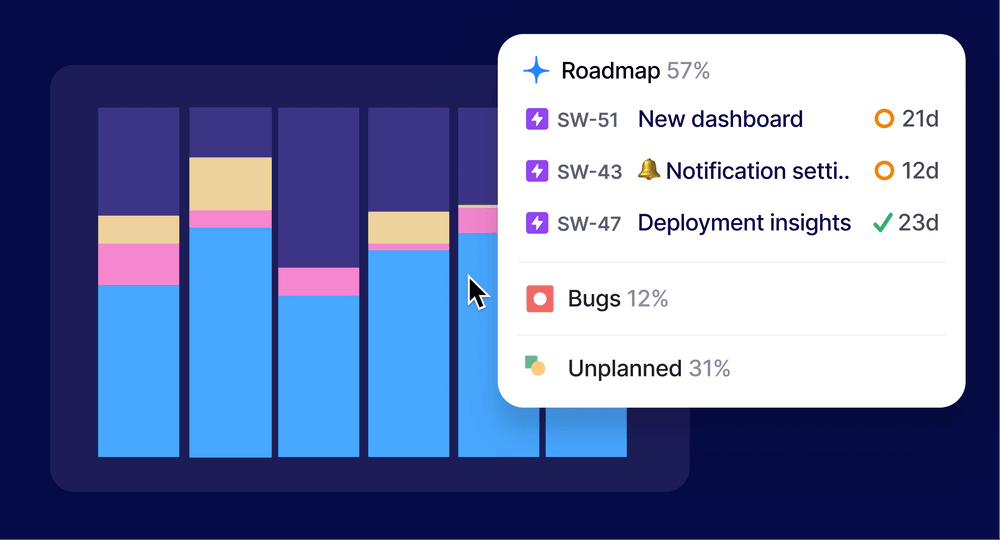
Another way to think about Impact is through the investment you're making. Do you understand how much of your engineering effort is going to your company's top priorities, used for keeping the lights on, dealing with technical debt, etc?
The reality is that sometimes it's difficult to attribute changes in business metrics to individual actions. It is more effective to understand how much you're investing in specific priorities and see if that investment is getting you what you want.
Business-specific measures
You’ll need to come up with a leading indicator that helps you understand your own business model faster than you could with lagging indicators such as revenue and profits.
Slack famously established that teams that have sent over 2000 messages have tried the product properly, and 93% of them are still using Slack today. This kind of proxy could be useful for developers responsible for optimizing the onboarding experience, but it might also be a company-wide KPI to align sales and marketing.
A SaaS business could focus on enterprise customers to drive up their Average Revenue per Customer. Yet the numbers lag due to an existing customer base and a successful SMB business. A better option might be looking at conversion rates and churn for companies of a certain size. Focusing on these metrics might lead the team to focus on user management, security & compliance, etc.
A team building a robot for picking up products in an e-commerce fulfilment center might want to optimize for the error rates of picking the wrong product or dropping the product.
Some metrics will stay intact for years while others may serve a more short-lived initiative.
Reinertsen suggests that "if you measure one thing, measure the cost of delay." In the absence of a more exact method of measuring the cost of delay, these business metrics are likely your best bet.
Flow – are we delivering continuously without getting stuck?
The unfortunate reality about complexity in software is that if you just keep doing what you've been doing, you'll keep slowing down. When starting a fresh project, you'll be surprised by how much you can accomplish in a day or two. And in some other environment, you could spend a week trying to get a new database column added.
Understanding the flow of work is critical because many of the issues are systemic. Even the most talented developer might not have the full picture of how much time is being wasted when work is bounced between the teams, half-completed features are put on the shelf as priorities change, or all the code gets reviewed by just one person. It's easy to think that you're solving a quality problem by introducing code freezes and release approvals, but in reality, it might not be worth it.
Flow of work is often measured in terms of cycle time. The term cycle time comes from manufacturing processes, where cycle time is the time it takes to produce a unit of your product, and lead time is the time it takes to fulfill an order (from a request to delivery).
In software development, these terms are often mixed. For most features, it might not be reasonable to track the full lead time of a feature, as in time from a customer requesting a feature to its delivery. Assuming that the team is working on a product that's supposed to serve a number of customers, it's unrealistic to expect that the features would be shipped as soon as the team first hears the idea.
Therefore, this article will discuss Flow in terms of cycle time, cycle time for issues, deployment frequency and deployment error rates.
Cycle time
When talking about cycle time for code, we're talking about the time it takes for code to reach production through code reviews and other process steps. Sometimes it's called change lead time.
Cycle time is the most important flow metric because it indicates how well your “engine” is running. The point is not to worry about slow activity but rather the periods of inactivity.
When diagnosing a high cycle time, your team might have a conversation about topics like this:
What other things are we working on? Start by visualizing all the work in progress. Be aware that your issue tracker might not tell the whole truth because development teams typically work on all kinds of ad-hoc tasks all the time.
How do we split our work? It's generally a good idea to ship in small increments. This might be more difficult if you can't use feature gates to enable features to customers gradually. Lack of infrastructure often leads to a branching strategy with long-lived branches and additional coordination overhead.
What does our automated testing setup look like? Is it easy to write and run tests? Can I trust the results from the Continuous Integration (CI) server?
How do we review code? Is only one person in the team responsible for code reviews? Do I need to request reviews from an outside technology expert? Is it clear who's supposed to review code? Do we as a team value that work, or is someone pushing us to get back to coding?
How well does the developer know the codebase? If all of the software was built by someone who left the company five years ago, chances are that development is going to be slow.
Is there a separate testing/quality assurance stage? Is testing happening close to the development team or is the work "handed off" to someone on the outside?
How often do we deploy to production/release our software? If the test coverage is low, you might not feel like deploying on Fridays. Or if deployment is not automated, you won't do it after every change. Deploying less frequently increases the batch size of a deployment, adding more risk to it, again reducing the frequency.
How much time is spent on tasks beyond writing code? Developers need focus time; it's difficult to get back to code on a 30-minute break between meetings.
Don’t treat cycle time as an aggregate metric to drive down. There are perfectly good reasons it will fluctuate and optimizing for a lower cycle time would be harmful. However, when used responsibly, it can be a great discussion-starter.
Cycle time for issues
Issue cycle time captures how long your Epics, Stories, Tasks (or however you plan your work) are in progress. Each team splits work differently, so they're not directly comparable. If we end up building the same product, it doesn't really matter whether that happens in five tasks taking four hours each, or four tasks taking five hours each.
We know that things don't always go smoothly. When you expected something to take three days and it ended up taking four weeks of grinding, your team most likely missed an opportunity to adjust plans together.
When you find yourself in this type of situation, here are some questions to ask:
What other things are we working on? Chances are your team delivered something but simply not this feature. Visualizing and limiting Work In Progress is a common cure.
How many people worked on this? Gravitating toward solo projects might feel like it eliminates the communication overhead and helps move things faster. From an individual's perspective, this is true, but it's not true for the team.
Are we good at sharing work? Splitting work is both a personal skill and an organizational capability. Developers will argue it's difficult to do. Nevertheless, do more of it, not less.
How accurate were our plans? If the scope of the feature increased by 200% during the development, it's possible that you didn't understand the customer use cases, got surprised by the technical implementation, or simply discovered some nasty corner cases on the way.
Was it possible to split this feature into smaller but still-functional slices? Product management, product design and developers need to work together to find a smart way to create the smallest possible end-to-end implementations. It's always difficult.
It feels great to work with a team that constantly delivers products to customers and gets to bask in the glory. That's what you get by improving issue cycle time.
Deployment frequency & error rate
Depending on the type of software you're building, "deployment" or "release" might mean different things. For a mobile app with an extensive QA process, getting to a two-week release cadence is already a good target, while the best teams building web backends deploy to production after each change.
Deployment frequency doubles both as a throughput metric and as a quality metric. When a team is afraid to deploy, they'll end up doing it less frequently. Solving the problem typically requires building more infrastructure. Some of the main considerations are:
If the build passes, can we feel good about deploying to production? If not, you'll likely want to start building tests from the top of the testing pyramid to test for significant regressions, building the infrastructure for writing good tests (with things like test data factories), and making sure that the team keeps writing tests for all new code. Whether tests get written cannot be dictated by outside stakeholders: it needs to be owned by the team.
If the build fails, do we know if it failed randomly or was caused by flaky tests? You'll want to understand which tests are causing most of your headaches so that you can focus efforts to improve the situation.
Is the deployment pipeline to production fully automated? If not, it's a good idea to keep automating it one step at a time. Investments in the CI/CD pipeline tend to pay back in no time.
Do we understand what happens in production after we've deployed? Building observability and alerting will take time. If you have a good baseline setup, it's easy to keep adding these along with your regular development tasks. If you don't have anything set up, it will never feel like it's the right time to add observability.
Are developers educated on the production infrastructure? Some developers never needed to touch a production environment. If it's not a part of their onboarding, few people are courageous enough to start making improvements on their own.
Some measures to avoid
Historically, agile teams have tracked "velocity" or "story points.” Originally meant as a way to help teams get better at splitting work, these units have been abused ever since. I've even seen teams invent their own word and unit for velocity so that someone doesn't accidentally try to use it to compare the teams.
If talking about story points helps you be more disciplined about scoping your sprints, go for it. If not, don't feel bad about dropping it, as long as you understand your cycle times.
Another traditional management pitfall is to focus on utilization, thinking that you want your developers to be 100% occupied. While it's true that 0% utilization is likely a signal about some problems, maximizing it will only lead to worse problems. As the utilization approaches 100%, the cycle times shoot up, and the team will slow down (as shown by Reinertsen). Additionally, you'll lose the creative problem-solving coming from your development teams.
There's a time and place for metrics around individual developers. In very healthy environments they could be used to improve the quality of coaching conversations while understanding the shortcomings of these measures. Unfortunately, in a bigger organization, an effort to focus on individual metrics is likely to derail your good intentions around data-driven continuous improvement. Developers will rightfully point out how the number of commits per day doesn't tell you how good of a developer they are. There are significant gains to be made in the team context alone, so why not start there?
Health – are we maintaining balanced ways of working?
The last dimension to measure is the health of the team. Good development practices are the foundation for a sustainable pace of working. It's also what keeps the team performing in the long run.
When the team functions well, you can expect good results in the other categories. Our discussion will consider team health checks, collaboration and siloing, automated testing, bugs, and production metrics.
Team health checks
Teams often have a continuous improvement cadence, such as a biweekly retrospective. The retrospectives might start repeating themselves, and I've found that it's good to occasionally prompt teams to evaluate themselves more holistically.
Spotify has published some of their own team health check PDFs and New Relic published their team-health assessment, but you're free to create your own based on your unique business and culture.
I used to ask my teams at Smartly.io to react to these statements in a survey every six months:
The team's bug backlog is manageable
The team has all the skills needed to build the products in their area
The team is able to test new product ideas with customers
The team constantly delivers work in small increments
The team doesn't have significant technical silos or abandoned features
The team's work is not blocked by other teams
The team has communicated a clear vision and how to get there
We feel safe to challenge each other, and our work is transparent
Instead of development practices, you might occasionally choose to focus on company culture, as proposed in Dr. Ron Westrum's research.
Collaboration & siloing
It's not obvious what a good level of collaboration is and how to measure it. Siloing is a word with a negative connotation, but an organization with no boundaries is an organization that doesn't get any work done.
In my experience, software engineering is largely a learning-bound problem. Teams need context about the business domain, customers, architecture, tools, and technical implementation details. There's no way this can be done with a one-time "knowledge transfer.” Thus, improving collaboration is your best shot at mitigating the learning bottleneck.
For developers, one of the best ways to learn is to work together with peers. This happens through code reviews, planning meetings, retrospectives, and most importantly, by just working on the different corners of the same problem.
I've found two useful dimensions for measuring collaboration:
Features: Having multiple developers working on the same feature means that people need to understand the same corner cases about the business domain. Even if it's a mobile developer and a backend developer working together, they share the definitions of the complex domain concepts.
Codebases: If a codebase has only been touched by one person, it's going to get increasingly difficult to onboard someone else to it. In a bigger codebase, this can be even applied at the file level.
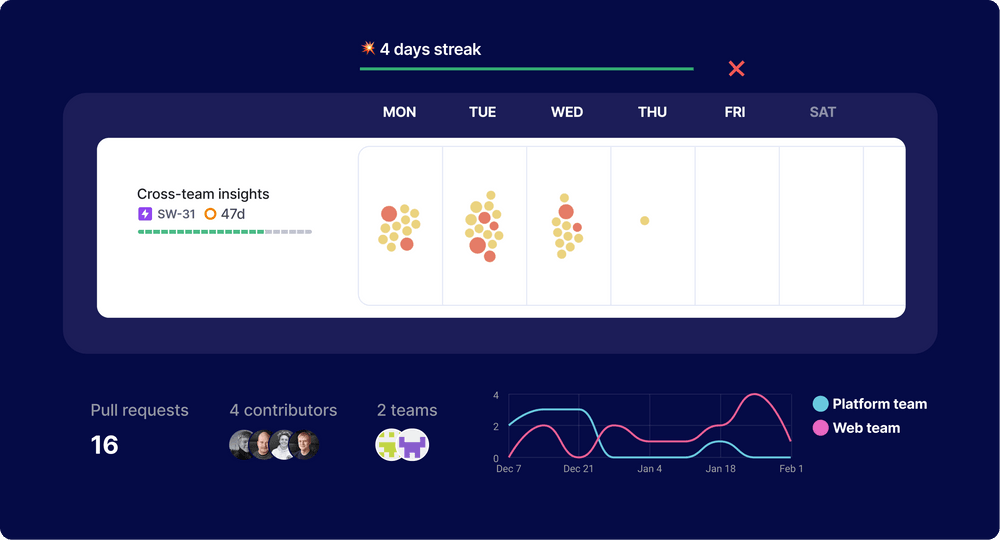
Most organizations think it's expensive to let developers learn about new business concepts and technologies. In reality, even a 20% increase in "less effective" learning work pales in comparison to the systemic effects of depending on a single developer to build something, let alone having to work on a codebase where all the original authors are long gone.
Automated testing
Tests are one of the primary tools for making sure that the codebase is maintainable in the long term. Many teams struggle with tests: do we have enough tests, are they reliable enough and do they run fast enough?
I've seen situations where a team fixes the same bug multiple times based on customer bug reports. Since none of the developers wrote tests for it, no one knew how it was supposed to work. Eventually, someone noticed that they were reverting to the previous bug fix and playing a game of bug tennis.
There are measures like code coverage that can be used for tests, but their applicability depends on your choice of technologies. For example, in a statically typed language, you might want to test different things than with a dynamically typed language.
The important thing is that the team agrees on how to test and does it consistently. Bug fixes should have a test. Features should have a test coverage that makes sense in your context. In fact, research shows that a high number of tests is a better indication of quality than code coverage.
It's also useful to understand if test flakiness is causing problems, and when your test suite is starting to take a long time (15+ minutes) to run.
Bugs
As we know from Principles of Product Development Flow, it's important to take interest in the queues. A bug backlog can be one of your most significant queues. I've seen teams with almost 1,000 open bugs, which obviously takes a lot of time to manage.
Bugs come in various shapes and sizes, and not all of them are created equal. Most organizations will want to treat them differently based on some segmentation around the expected impact. For the most critical bugs you'll want to make sure that they're fixed – immediately.
As a rule of thumb, I suggest making sure that the number of bugs in your bug backlog is not more than 3x the number of developers in the team. Going from 1000 open bugs to 15 is a topic for a whole another blog post. 🙂
Production metrics
Developers need to understand how their software performs in production. This includes things like exceptions, slow queries and queue lengths. Luckily, this is already well-covered in many teams.
Doing this in practice
In most companies software development is not really measured, possibly with the exception of production infrastructure dashboards and story points. This is the result of the industry taking decades to recover from the trauma of trying to measure lines of code.
The purpose of this article is not to get your organization to measure everything listed; getting from 0 to 100 is not the point. Do not treat these ideas as a "maturity model,” where more process and more measurement equals better. Instead, strive for the minimal process that makes sense with the problems you're dealing with. My goal here is to provide a fresh way of looking at the dimensions that matter in developer productivity. To me, these are: Impact, Flow and Health.
You'll want to build an organization that's well-educated on development productivity practices, tools, and research, but one that is ultimately focused on solving the most pressing problems iteratively. The company culture needs to support a high-quality discussion that is informed by metrics rather than focused on chasing an individual number.
Solutions only make sense when presented in the context of a problem. With good infrastructure, teams can better act on the advice in this article and run the full continuous improvement cycle from identifying problems to changing habits.


